Carnival Cruises 2014 Annual Report Download - page 13
Download and view the complete annual report
Please find page 13 of the 2014 Carnival Cruises annual report below. You can navigate through the pages in the report by either clicking on the pages listed below, or by using the keyword search tool below to find specific information within the annual report.-
 1
1 -
2
-
 3
3 -
 4
4 -
 5
5 -
 6
6 -
 7
7 -
 8
8 -
 9
9 -
 10
10 -
 11
11 -
 12
12 -
 13
13 -
 14
14 -
 15
15 -
 16
16 -
 17
17 -
 18
18 -
 19
19 -
 20
20 -
 21
21 -
 22
22 -
 23
23 -
24
-
25
-
26
-
27
-
28
-
29
-
30
-
31
-
32
-
33
-
34
-
35
-
36
-
37
-
38
-
39
-
40
-
41
-
42
-
43
-
44
-
45
-
46
-
47
-
48
-
49
-
50
-
51
-
52
-
53
-
54
-
55
-
56
-
57
-
58
-
59
-
60
-
61
-
62
-
63
-
64
-
65
-
66
-
67
-
68
-
69
-
70
-
71
-
72
-
73
-
74
-
75
-
76
-
77
-
78
-
79
-
80
 |
 |

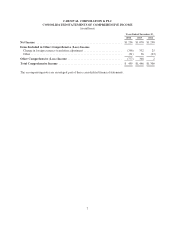
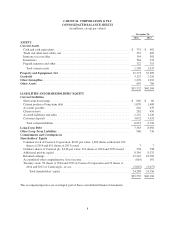
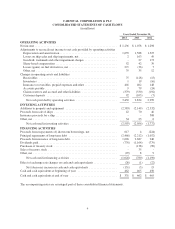
CARNIVAL CORPORATION & PLC
NOTES TO CONSOLIDATED FINANCIAL STATEMENTS
NOTE 1 – General
Description of Business
Carnival Corporation is incorporated in Panama and Carnival plc is incorporated in England and Wales. Carnival
Corporation and Carnival plc operate a dual listed company (“DLC”), whereby the businesses of Carnival
Corporation and Carnival plc are combined through a number of contracts and through provisions in Carnival
Corporation’s Articles of Incorporation and By-Laws and Carnival plc’s Articles of Association. The two
companies operate as if they are a single economic enterprise, but each has retained its separate legal
identity. Each company’s shares are publicly traded; on the New York Stock Exchange (“NYSE”) for Carnival
Corporation and the London Stock Exchange for Carnival plc. In addition, Carnival plc American Depository
Shares are traded on the NYSE (see Note 3).
The consolidated financial statements include the accounts of Carnival Corporation and Carnival plc and their
respective subsidiaries. Together with their consolidated subsidiaries, they are referred to collectively in these
consolidated financial statements and elsewhere in this 2014 Annual Report as “Carnival Corporation & plc,”
“our,” “us” and “we.”
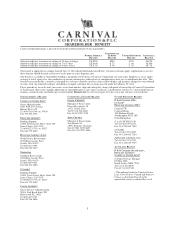
We are the largest cruise company and among the largest leisure travel companies in the world. Each of our nine
leading global, regional and national brands is an operating segment that we aggregate into either the (1) North
America or (2) Europe, Australia & Asia (“EAA”) reportable cruise segments (see Note 11). As of January 22,
2015, our cruise brands’ summary information is as follows:
Cruise Brands
Passenger
Capacity (a)
Percentage
of Total
Capacity
Number of
Cruise Ships
North America
Carnival Cruise Line ..................................... 62,366 29% 24
Princess Cruises (“Princess”) .............................. 44,090 21 18
Holland America Line ................................... 23,540 11 15
Seabourn .............................................. 1,782 1 5
North America Cruise Brands .......................... 131,778 62 62
EAA
Costa Cruises (“Costa”) .................................. 35,828 17 15
AIDA Cruises (“AIDA”) ................................. 18,656 9 10
P&O Cruises (UK) ...................................... 14,736 7 7
Cunard ................................................ 6,694 3 3
P&O Cruises (Australia) .................................. 4,804 2 3
EAA Cruise Brands .................................. 80,718 38 38
212,496 100% 100
(a) In accordance with cruise industry practice, passenger capacity is calculated based on the assumption of two
passengers per cabin even though some cabins can accommodate three or more passengers.
11