Brother International 2015 Annual Report Download
Download and view the complete annual report
Please find the complete 2015 Brother International annual report below. You can navigate through the pages in the report by either clicking on the pages listed below, or by using the keyword search tool below to find specific information within the annual report.-
 1
1 -
 2
2 -
 3
3 -
 4
4 -
 5
5 -
 6
6
 |
 |

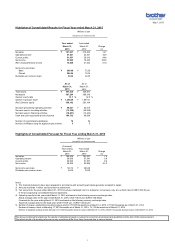
Highlights of Consolidated Results for Fiscal Year ended March 31, 2015
Change
(%)
Net sales Y 707,237 Y 616,834 14.7
Operating income 57,541 43,301 32.9
Current profits 51,557 35,613 44.8
Net income 53,969 19,220 180.8
(Ref.) Comprehensive income 75,548 41,553 81.8
Net income per share:
Basic Y 206.68 Y 72.20
Diluted 206.24 72.06
Dividends per common share 30.00 24.00
Total assets Y 567,230 Y 469,973
Net assets 367,284 308,310
Owners' equity ratio 61.7 % 62.0 %
Owners' equity per share Y 1,348.69 Y 1,097.01
(Ref.) Owners' equity 350,162 291,164
Net cash provided by operating activities Y 58,021 Y 55,019
Net cash used in investing activities (15,326) (39,099)
Net cash used in financing activities (18,451) (13,433)
Cash and cash equivalents at end of period 104,732 68,934
Number of consolidated subsidiaries 74 62
Number of affiliates using the applied equity method 55
Highlights of Consolidated Forecast for Fiscal Year ending March 31, 2016
Change
(%)
Net sales
Y
760,000
Y
707,237 7.5
Operating income 58,000 57,541 0.8
Current profits 56,000 51,557 8.6
Net income 35,500 53,969 -34.2
Net income per share
Y
136.73
Y
206.68
Dividends per common share 36.00 30.00
Notes:
1) The financial statements have been prepared in accordance with accounting principles generally accepted in Japan.
2) Amounts less than 1 million yen have been rounded down.
3) Yen amounts for the year ended March 31, 2015 have been translated into U.S. dollars for convenience only, at a uniform rate of US$1=103.00 yen,
in the accompanying consolidated financial statements.
4) Operating results for the year ended March 31, 2015 are based on the following currency exchange rates:
Actual average rates for the year ended March 31, 2015: US$=110.03 yen, EURO=138.68yen
Forecasts for the year ending March 31, 2016 are based on the following currency exchange rates:
Assumed average rates for the fiscal year: US$=115.00 yen, EURO=125.00 yen
5) Number of shares outstanding (including treasury stock): 277,535 thousands as of March 31, 2015, 277,535 thousands as of March 31, 2014
Number of treasury stock outstanding: 17,903 thousands as of March 31, 2015, 12,118 thousands as of March 31, 2014
Number of weighted average shares (full year): 261,125 thousands during the year ended March 31, 2015, 266,213 thousands during the year ended March 31, 2014
The above-mentioned forecasts are the results of estimations based on outlook for economic environment and predictions at the time of this announcement.
The actual results of business performance may sometimes differ from these forecasts due to various factors.
May 7, 2015
Millions of yen
(except for per share amounts)
March 31, March 31,
Year ended Year ended
2015 2014
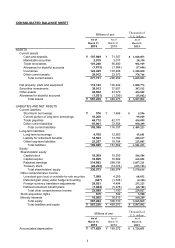
As of As of
March 31, March 31,
2015 2014
2016 2015
Millions of yen
(except for per share amounts)
[Forecast]
Year ending Year ended
March 31, March 31,
1
Table of contents
-
Page 1
...for the fiscal year: US$=115.00 yen, EURO=125.00 yen 5) Number of shares outstanding (including treasury stock): 277,535 thousands as of March 31, 2015, 277,535 thousands as of March 31, 2014 Number of treasury stock outstanding: 17,903 thousands as of March 31, 2015, 12,118 thousands as of March 31... -
Page 2
... Other long-term liabilities Total liabilities Equity Shareholders' equity Capital stock Capital surplus Retained earnings Treasury stock Total shareholders' equity Other comprehensive income Unrealized gain (loss) on available-for-sale securities 2014 2015 Y 107,949 2,915 101,240 (1,813) 122... -
Page 3
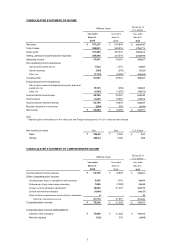
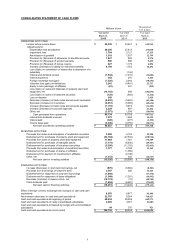
CONSOLIDATED STATEMENT OF INCOME Millions of yen Year ended March 31, Year ended March 31, Thousands of U.S. dollars Year ended March 31, 2015 Net sales Cost of sales Gross profit Selling, general and administrative expenses Operating income Non-operating income (expenses): Interest and dividend ... -
Page 4
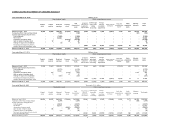
... 31, 2015 Shareholders' equity Total shareholders' equity Thousands of U.S. dollars Other comprehensive income Unrealized gain Deferred gain (loss) on (loss) under available-forhedge sale securities accounting Capital stock Capital surplus Retained earnings Treasury stock Foreign currency... -
Page 5
...yen Year ended March 31, Year ended March 31, Thousands of U.S. dollars Year ended March 31, 2015...earnings) of affiliates Loss (Gain) on sales and disposals of property, plant and equipment, net Loss (Gain) on sales of investment securities Loss on disaster Decrease (Increase) in trade... stock,... -
Page 6
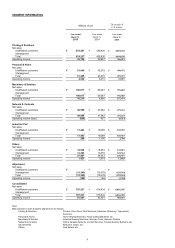
..., Typewriters, Scanners Personal & Home Home Sewing Machines, Home Cutting Machines, etc. Machinery & Solution Industrial Sewing Machines, Machine Tools, Garment Printers Network & Contents Online Karaoke Systems, Content Services, Content-delivery Systems, etc. Industrial Part Reducers, Gears...