Blizzard 2010 Annual Report Download - page 9
Download and view the complete annual report
Please find page 9 of the 2010 Blizzard annual report below. You can navigate through the pages in the report by either clicking on the pages listed below, or by using the keyword search tool below to find specific information within the annual report.-
 1
1 -
 2
2 -
 3
3 -
 4
4 -
 5
5 -
 6
6 -
 7
7 -
 8
8 -
 9
9 -
 10
10 -
 11
11 -
 12
12 -
 13
13 -
 14
14 -
 15
15 -
 16
16 -
 17
17 -
 18
18 -
 19
19 -
 20
20 -
21
-
22
-
23
-
24
-
25
-
26
-
27
-
28
-
29
-
30
-
31
-
32
-
33
-
34
-
35
-
36
-
37
-
38
-
39
-
40
-
41
-
42
-
43
-
44
-
45
-
46
-
47
-
48
-
49
-
50
-
51
-
52
-
53
-
54
-
55
-
56
-
57
-
58
-
59
-
60
-
61
-
62
-
63
-
64
-
65
-
66
-
67
-
68
-
69
-
70
-
71
-
72
-
73
-
74
-
75
-
76
-
77
-
78
-
79
-
80
-
81
-
82
-
83
-
84
-
85
-
86
-
87
-
88
-
89
-
90
-
91
-
92
-
93
-
94
 |
 |
2 0 1 0 A N N U A L R E P O R T
7
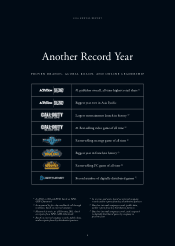
2010 Results: Another Record Yeari—In 2010, we delivered non-GAAP net revenues of $4.8 billion
and grew non-GAAP earnings per diluted share by 14.5% year over year to $0.79. On a GAAP basis,
our net revenues were $4.4 billion and earnings per diluted share were $0.33. Although we are firm
believers that the use of Generally Accepted Accounting Principles (GAAP) is an appropriate lens
through which to view our performance, we believe that the use of non-GAAP financial measures
provides investors with an additional important perspective from which to view our results that is
consistent with the way management assesses our business.
Our strong performance this year enhanced our financial position. We ended the year with approxi-
mately $3.5 billion in cash and investments and no debt.
We generated a record $1.4 billion in operating cash flow, a good measure of how we build share-
holder value. We also delivered the most profitable year in our company’s history, as well as a record
non-GAAP operating margin of 29%, an industry recordii, and a return on invested capital of 30%iii.
These financial metrics are reflections of our continued migration to, and leadership in, online enter-
tainment and a clear illustration that our strategy and continued superb execution should provide
superior long-term returns for our shareholders.
Our commitment to entertaining audiences with excellent games hasn’t changed in twenty years—
but the way we reach our audiences, and the methods our audiences have available to determine how
they best want to pay for our content, have changed greatly.
We continue to heavily invest in our franchises, in new potential franchises, and in our systems and
capabilities to bring our products and services to new markets around the world. Yet, we are generat-
ing more cash than we can find good uses for. As a result, in 2010, we became the first company
in our industry to issue a dividend and we repurchased nearly $1 billion of our stock, bringing our
two-year share buyback total to approximately $2.2 billion. We think buying our own shares repre-
sents a very good investment for our shareholders and, if our share price remains within our targets
for repurchase, we plan to continue to buy the additional $1.5 billion worth of shares that our Board
recently authorized us to repurchase. We are always on the lookout for ways to use our capital
thoughtfully, and it is probably worth mentioning that the criteria haven’t changed much in twenty
years. We like to invest our capital in proprietary products or services that have a history of profit-
ability (which we measure in years, not days or months), are internationally appealing, serve to deepen
our moats, and can reasonably be expected to generate a financial return that is greater than our
weighted average cost of capital.
To our shareholders: