Baker Hughes 2010 Annual Report Download - page 4
Download and view the complete annual report
Please find page 4 of the 2010 Baker Hughes annual report below. You can navigate through the pages in the report by either clicking on the pages listed below, or by using the keyword search tool below to find specific information within the annual report.-
 1
1 -
 2
2 -
 3
3 -
 4
4 -
 5
5 -
 6
6 -
 7
7 -
 8
8 -
 9
9 -
 10
10 -
 11
11 -
 12
12 -
 13
13 -
 14
14 -
 15
15 -
16
-
17
-
18
-
19
-
20
-
21
-
22
-
23
-
24
-
25
-
26
-
27
-
28
-
29
-
30
-
31
-
32
-
33
-
34
-
35
-
36
-
37
-
38
-
39
-
40
-
41
-
42
-
43
-
44
-
45
-
46
-
47
-
48
-
49
-
50
-
51
-
52
-
53
-
54
-
55
-
56
-
57
-
58
-
59
-
60
-
61
-
62
-
63
-
64
-
65
-
66
-
67
-
68
-
69
-
70
-
71
-
72
-
73
-
74
-
75
-
76
-
77
-
78
-
79
-
80
-
81
-
82
-
83
-
84
-
85
-
86
-
87
-
88
-
89
-
90
-
91
-
92
-
93
-
94
-
95
-
96
-
97
-
98
-
99
-
100
-
101
-
102
-
103
-
104
-
105
-
106
-
107
-
108
-
109
-
110
-
111
-
112
-
113
-
114
-
115
-
116
-
117
-
118
-
119
-
120
-
121
-
122
-
123
-
124
-
125
-
126
-
127
-
128
-
129
-
130
-
131
-
132
-
133
-
134
-
135
-
136
-
137
-
138
-
139
-
140
-
141
-
142
-
143
-
144
-
145
-
146
-
147
-
148
-
149
-
150
-
151
-
152
-
153
-
154
-
155
-
156
-
157
-
158
 |
 |

The accomplishments of 2010 marked a significant milestone in our
multi-year efforts to transform Baker Hughes and position the company
for growth and long-term profitability.
2 B a k e r H u g h e s I n c o r p o r a t e d
To Our Stockholders In 2010, after a year-long effort to obtain full government approval, we completed the
acquisition of BJ Services and integrated pressure pumping, coiled tubing and cementing
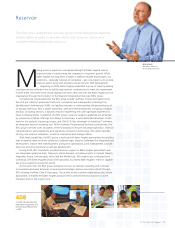
capabilities into our global service offering. We also further reinforced our reservoir capa-
bilities through acquisition and realignment of our consulting services; our geographic and
business segment organization became fully functional; and, our enterprise-level supply
chain effort began to deliver signif icant cost savings.
In North America, the “unconventional” gas and oil plays became the foundation of our
land business, driving demand for directional drilling, advanced completion systems and
pressure pumping.
In April 2010, the industry mourned the loss of 11 men working on the Deepwater Horizon.
Although we were not involved in the accident, we did provide products and services to help with
the capping, relief well and clean-up efforts following the blowout. The accident and associated
spill negatively impacted our business in the Gulf of Mexico, as the drilling moratorium, the cre-
ation of new regulations, and the pace of permit approval impeded all new drilling activity from
late April through the end of the year. Given the difficulty of permitting new wells both in deep
water and on the shelf, we saw increased demand for our workover and stimulation services to
battle production declines, but not enough to offset the revenue we would have generated from
the 33 deepwater rigs that were idled.
The international market entered what we believe to be a multi-year trend of increasing
spending as the global industry battles decline curves and invests to satisfy expanding global
demand for oil and natural gas.
Financial Results
In 2010, Baker Hughes recorded its highest annual revenue to date, with top-line growth
driven by our acquisition of BJ Services. Baker Hughes results for the year include results of
BJ Services starting from May 2010.
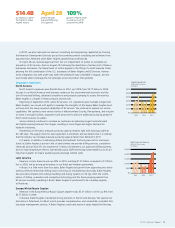
Revenue for 2010 was $14.41 billion, up 49% compared to $9.66 billion in 2009. Net income
attributable to Baker Hughes for 2010 was $812 million or $2.06 per diluted share, compared to
$421 million or $1.36 per diluted share for 2009.
Earnings before interest, taxes, depreciation and amortization, or “EBITDA,” for 2010 were
$6.63 per diluted share, up 41% from $4.70 for 2009.
Capital expenditures were $1.49 billion, depreciation and amortization expense was $1.07 bil-
lion and dividend payments were $241 million in the year 2010.
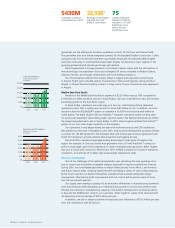
At the end of 2010, Baker Hughes had $3.88 billion in debt, and cash and short-term invest-
ments of $1.71 billion. We also had $1.7 billion undrawn and available under committed credit
facilities. Our debt to capital ratio was 21%. Our net debt was $2.2 billion and our net debt to
capital ratio was 13%.
Transformation Complete
For the past several years, Baker Hughes has invested in building a diverse global workforce,
expanding our infrastructure to support growing markets in North America and internationally, to
develop new technology and expand our capabilities to do so, and to deliver products and equip-
ment to serve our clients. This investment set the stage for further changes to make us stronger
and more competitive.
In May 2009, we announced a fundamental change in Baker Hughes’ organizational struc-
ture, moving from a product line organization managed through divisions to a geographic organi-
zation managed through geomarkets. The geographic organization has met our objectives of
building closer relationships with our customers and developing a more holistic view of
the market while maintaining excellence in rig site execution and safety.