Avnet 2008 Annual Report Download - page 19
Download and view the complete annual report
Please find page 19 of the 2008 Avnet annual report below. You can navigate through the pages in the report by either clicking on the pages listed below, or by using the keyword search tool below to find specific information within the annual report.-
 1
1 -
2
-
3
-
4
-
5
-
6
-
7
-
8
-
 9
9 -
 10
10 -
 11
11 -
 12
12 -
 13
13 -
 14
14 -
 15
15 -
 16
16 -
 17
17 -
 18
18 -
 19
19 -
 20
20 -
 21
21 -
 22
22 -
 23
23 -
 24
24 -
 25
25 -
 26
26 -
 27
27 -
 28
28 -
 29
29 -
30
-
31
-
32
-
33
-
34
-
35
-
36
-
37
-
38
-
39
-
40
-
41
-
42
-
43
-
44
-
45
-
46
-
47
-
48
-
49
-
50
-
51
-
52
-
53
-
54
-
55
-
56
-
57
-
58
-
59
-
60
-
61
-
62
-
63
-
64
-
65
-
66
-
67
-
68
-
69
-
70
-
71
-
72
-
73
-
74
-
75
-
76
-
77
-
78
-
79
-
80
-
81
-
82
-
83
-
84
-
85
-
86
-
87
-
88
-
89
-
90
-
91
-
92
-
93
-
94
-
95
-
96
 |
 |

Table of Contents
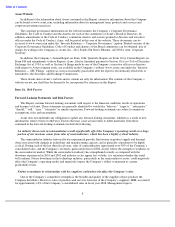
Issuer Purchases of Equity Securities
The following table includes the Company’s monthly purchases of common stock during the fourth quarter
ended June 28, 2008:
The purchases of Avnet common stock noted above were made on the open market to obtain shares for purchase
under the Company’s Employee Stock Purchase Plan. None of these purchases were made pursuant to a publicly
announced repurchase plan and the Company does not currently have a stock repurchase plan in place.
16
Maximum Number (or
Total Number of
Approximate Dollar
Total
Shares Purchased as
Value) of Shares That
Number of
Part of Publicly
may yet be Purchased
Shares
Average Price
Announced Plans or
Under the Plans or
Period
Purchased
Paid per Share
Programs
Programs
April
4,500
$
33.49
—
—
May
12,000
$
27.09
—
—
June
5,500
$
31.17
—
—
Item 6.
Selected Financial Data
Years Ended
June 28,
June 30,
July 1,
July 2,
July 3,
2008
2007
2006
2005
2004
(Millions, except for per share and ratio data)
Income:
Sales
$
17,952.7
$
15,681.1
$
14,253.6
$
11,066.8
$
10,244.7
Gross profit
2,313.7
2,048.6
1,839.0
(c)
1,459.0
1,364.9
Operating income
710.4
(a)
678.3
(b)
433.1
(c)
321.3
202.2
(d)
Income tax provision
209.9
(a)
193.5
(b)
111.6
(c)
71.5
25.5
(d)
Net income
499.1
(a)
393.1
(b)
204.5
(c)
168.2
72.9
(d)
Financial Position:
Working capital
3,191.5
2,711.8
2,029.1
2,065.4
1,839.0
Total assets
8,200.1
7,355.1
6,215.7
5,098.2
4,863.7
Long
-
term debt
1,181.5
1,156.0
918.8
1,183.2
1,196.2
Shareholders
’
equity
4,134.7
3,400.6
2,831.2
2,097.0
1,953.4
Per Share:
Basic earnings
3.32
(a)
2.65
(b)
1.40
(c)
1.39
0.61
(d)
Diluted earnings
3.27
(a)
2.63
(b)
1.39
(c)
1.39
0.60
(d)
Book value
27.49
22.70
19.30
17.36
16.21
Ratios:
Operating income margin on sales
4.0
%(a)
4.3
%(b)
3.0
%(c)
2.9
%
2.0
%(d)
Net income margin on sales
2.8
%(a)
2.5
%(b)
1.4
%(c)
1.5
%
0.7
%(d)
Return on equity
13.3
%(a)
12.7
%(b)
7.8
%(c)
8.1
%
3.9
%(d)
Return on capital
10.9
%(a)
11.2
%(b)
7.6
%(c)
7.5
%
5.1
%(d)
Quick
1.4:1
1.3:1
1.1:1
1.5:1
1.3:1
Working capital
2.1:1
2.0:1
1.8:1
2.2:1
2.1:1
Total debt to capital
22.9
%
26.2
%
30.4
%
37.2
%
41.0
%
(a)
Includes the impact of restructuring, integration and other items, gains on sale of assets and other items which
totaled to a gain of $11.0 million pre
-
tax, $14.7 million after tax and $0.09 per share on a diluted basis (see