Arrow Electronics 2010 Annual Report Download - page 2
Download and view the complete annual report
Please find page 2 of the 2010 Arrow Electronics annual report below. You can navigate through the pages in the report by either clicking on the pages listed below, or by using the keyword search tool below to find specific information within the annual report.-
 1
1 -
 2
2 -
 3
3 -
 4
4 -
 5
5 -
 6
6 -
 7
7 -
 8
8 -
 9
9 -
 10
10 -
 11
11 -
 12
12 -
 13
13 -
14
-
15
-
16
-
17
-
18
-
19
-
20
-
21
-
22
-
23
-
24
-
25
-
26
-
27
-
28
-
29
-
30
-
31
-
32
-
33
-
34
-
35
-
36
-
37
-
38
-
39
-
40
-
41
-
42
-
43
-
44
-
45
-
46
-
47
-
48
-
49
-
50
-
51
-
52
-
53
-
54
-
55
-
56
-
57
-
58
-
59
-
60
-
61
-
62
-
63
-
64
-
65
-
66
-
67
-
68
-
69
-
70
-
71
-
72
-
73
-
74
-
75
-
76
-
77
-
78
-
79
-
80
-
81
-
82
-
83
-
84
-
85
-
86
-
87
-
88
-
89
-
90
-
91
-
92
-
93
-
94
-
95
-
96
-
97
-
98
 |
 |

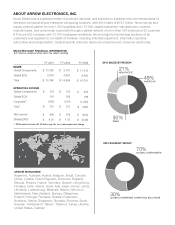
ABOUT ARROW ELECTRONICS, INC.
Arrow Electronics is a global provider of products, services, and solutions to industrial and commercial users of
electronic components and enterprise computing solutions, with 2010 sales of $18.7 billion. Arrow serves as a
supply channel partner for over 1,200 suppliers and 115,000 original equipment manufacturers, contract
manufacturers, and commercial customers through a global network of more than 340 locations in 52 countries.
A Fortune 200 company with 12,700 employees worldwide, Arrow brings the technology solutions of its
customers and suppliers to a breadth of markets, including industrial equipment, information systems,
automotive and transportation, medical and life sciences, telecommunications and consumer electronics.
2010 SALES BY REGION
2010 SALES BY GROUP
21%
ASIA/PACIFIC
49%
AMERICAS
30%
EMEA
70%
GLOBAL COMPONENTS
30%
GLOBAL ENTERPRISE COMPUTING SOLUTIONS
SELECTED GAAP FINANCIAL INFORMATION
($ in millions, except per share data; may refl ect rounding)
FY 2010 FY 2009 FY 2008
$ 13,168
5,576
$ 18,745
$ 9,751
4,933
$ 14,684
$ 11,319
5,442
$ 16,761
Global Components
Global ECS
Total
$ 715
191
(156)
$ 751
$ 319
168
(214)
$ 273
$ 533
196
(1,223)
$ (494)
Global Components
Global ECS
Corporate(1)
Total(1)
$ 480
$ 4.01
$ 124
$ 1.03
$ (614)
$ (5.08)
Net income(1)
DIluted EPS(1)
(1) 2008 results include a $1.02 billion pre-tax, non-cash impairment charge
SALES
OPERATING INCOME
ARROW WORLDWIDE
Argentina, Australia, Austria, Belgium, Brazil, Canada,
China, Croatia, Czech Republic, Denmark, England,
Estonia, Finland, France, Germany, Greece, Hong Kong,
Hungary, India, Ireland, Israel, Italy, Japan, Korea, Latvia,
Lithuania, Luxembourg, Malaysia, Mexico, Morocco,
Netherlands, New Zealand, Norway, Philippines,
Poland, Portugal, Romania, Russian Federation,
Scotland, Serbia, Singapore, Slovakia, Slovenia, Spain,
Sweden, Switzerland, Taiwan, Thailand, Turkey, Ukraine,
United States, Vietnam