Arrow Electronics 2000 Annual Report Download - page 3
Download and view the complete annual report
Please find page 3 of the 2000 Arrow Electronics annual report below. You can navigate through the pages in the report by either clicking on the pages listed below, or by using the keyword search tool below to find specific information within the annual report.-
 1
1 -
 2
2 -
 3
3 -
 4
4 -
 5
5 -
 6
6 -
 7
7 -
 8
8 -
 9
9 -
 10
10 -
 11
11 -
 12
12 -
 13
13 -
 14
14 -
15
-
16
-
17
-
18
-
19
-
20
-
21
-
22
-
23
-
24
-
25
-
26
-
27
-
28
-
29
-
30
-
31
-
32
-
33
-
34
-
35
-
36
-
37
-
38
-
39
-
40
-
41
-
42
-
43
-
44
-
45
-
46
-
47
-
48
-
49
-
50
 |
 |

For the year 2000 1999* 1998
Sales $12,959,250 $9,312,625 $8,344,659
Operating income 784,107 338,661 352,504
Net income 357,931 124,153 145,828
Earnings per share
Basic 3.70 1.31 1.53
Diluted 3.62 1.29 1.50
At year-end
Total assets $7,604,541 $4,483,255 $3,839,871
Shareholders’ equity 1,913,748 1,550,529 1,487,319
Common shares outstanding 98,411 95,945 95,628
* Includes a special charge associated with the acquisition and integration of Richey Electronics, Inc. and the
electronics distribution group of Bell Industries, Inc. Excluding this charge, operating income, net income, and
earnings per share on a basic and diluted basis were $363.2 million, $140.6 million, $1.48, and $1.46, respectively.
ARROW’S financial highlights
(In thousands except per share data)
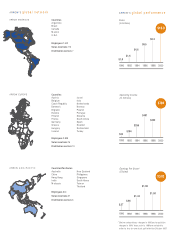
Productivity
(Sales per employee
in thousands)
1992
$426 $561
$754
1994 1996 1998 2000
$859
$1,060
Employees
(In thousands)
1992
2.3
6.2 7.6
1994 1996 1998 2000
9.6
12.2
Transactions Per Day
(In millions)
1992
.7 1.2
3.4
1994 1996 1998 2000
4.9
9.6
2.9
1990
1990
$872 6.2
1990