Anthem Blue Cross 2014 Annual Report Download - page 12
Download and view the complete annual report
Please find page 12 of the 2014 Anthem Blue Cross annual report below. You can navigate through the pages in the report by either clicking on the pages listed below, or by using the keyword search tool below to find specific information within the annual report.-
 1
1 -
 2
2 -
 3
3 -
 4
4 -
 5
5 -
 6
6 -
 7
7 -
 8
8 -
 9
9 -
 10
10 -
 11
11 -
 12
12 -
 13
13 -
 14
14 -
 15
15 -
 16
16 -
 17
17 -
 18
18 -
 19
19 -
 20
20
 |
 |
P
ANTHEM REDEFINING REINVENTING REASSURING
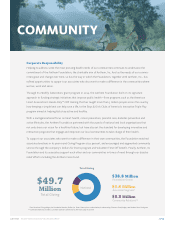
COMMUNITY
Creating a Healthier Future
for Children, Adults and Seniors
COMMUNITY
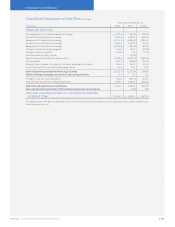
FINANCIAL
INFORMATION
FINANCIAL
INFORMATION
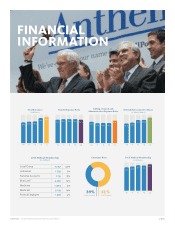
‘10 ‘11 ‘12 ‘13 ‘14
Total Revenues
(In Billions)
$58.7
$60.7 $61.5
$71.0 $73.9
‘10 ‘11 ‘12 ‘13 ‘14
Benefit Expense Ratio
83.2%
85.1%
85.3% 85.1% 83.1%
‘10 ‘11 ‘12 ‘13 ‘14
Selling, General and
Administrative Expense Ratio
15.1% 14.1% 14.3% 14.2%
16.1%
Diluted Net Income Per Share
(In Whole Dollars)
‘10 ‘11 ‘12 ‘13 ‘14
$6.94 $7.25
$8.18 $8.20
$8.99
Total Medical Membership
(In Millions)
‘10 ‘11 ‘12 ‘13 ‘14
33.3 34.3 36.1 35.7 37.5
Customer Base
61%
Self-Funded
39%
Fully-Insured
Local Group 15.137 40%
Individual 1.793 5%
National Accounts 7.155 19%
BlueCard® 5.279 14%
Medicare 1.404 4%
Medicaid 5.193 14%
Federal Employee 1.538 4%
2014 Medical Membership
(In Millions)