Amgen 2000 Annual Report Download - page 4
Download and view the complete annual report
Please find page 4 of the 2000 Amgen annual report below. You can navigate through the pages in the report by either clicking on the pages listed below, or by using the keyword search tool below to find specific information within the annual report.-
 1
1 -
 2
2 -
 3
3 -
 4
4 -
 5
5 -
 6
6 -
 7
7 -
 8
8 -
 9
9 -
 10
10 -
 11
11 -
 12
12 -
 13
13 -
 14
14 -
 15
15 -
16
-
17
-
18
-
19
-
20
-
21
-
22
-
23
-
24
-
25
-
26
-
27
-
28
-
29
-
30
-
31
-
32
-
33
-
34
-
35
-
36
-
37
-
38
-
39
-
40
-
41
-
42
-
43
-
44
-
45
-
46
-
47
 |
 |

Consolidated Statement of Operations Data
(In millions, except per share data)
Years ended December 31, 2000 1999 1998 1997 1996 1995 1994 1993 1992 1991
Revenues:
Product sales1$ 3,202.2 $ 3,042.8 $ 2,514.4 $ 2,219.8 $ 2,088.2 $ 1,818.6 $ 1,549.6 $ 1,306.3 $ 1,050.7 $ 645.3
Other revenues 427.2 297.3 203.8 181.2 151.6 121.3 98.3 67.5 42.3 36.7
Total revenues 3,629.4 3,340.1 2,718.2 2,401.0 2,239.8 1,939.9 1,647.9 1,373.8 1,093.0 682.0
Research and development expenses 845.0 822.8 663.3 630.8 528.3 451.7 323.6 255.3 182.3 120.9
Selling, general, and administrative expenses 826.9 654.3 515.4 483.8 470.6 418.4 359.8 328.4 292.2 202.6
Other items, net2(18.8) (49.0) (23.0) 157.0 —— 116.4 (13.9) (77.1) 129.1
Net income 1,138.5 1,096.4 863.2 644.3 679.8 537.7 319.7 383.3 357.6 97.9
Diluted earnings per share 1.05 1.02 0.82 0.59 0.61 0.48 0.29 0.33 0.30 0.08
Cash dividends per share ——————————
Consolidated Balance Sheet Data
(In millions)
At December 31, 2000 1999 1998 1997 1996 1995 1994 1993 1992 1991
Total assets $ 5,399.6 $ 4,077.6 $ 3,672.2 $ 3,110.2 $ 2,765.6 $ 2,432.8 $ 1,994.1 $ 1,765.5 $ 1,374.3 $ 865.5
Long-term debt 223.0 223.0 223.0 229.0 59.0 177.2 183.4 181.2 129.9 39.7
Stockholders’ equity 4,314.5 3,023.5 2,562.2 2,139.3 1,906.3 1,671.8 1,274.3 1,172.0 933.7 531.1
1Due to Year 2000 contingency planning in the fourth quarter of 1999, the Company offered extended payment terms on limited shipments of EPOGEN®(Epoetin alfa) and NEUPOGEN®
(Filgrastim) to certain wholesalers. These Year 2000 related sales totaled $45 million, or $0.02 per share, in 1999.
2Amounts primarily comprised of benefits and expenses related to various legal proceedings. The amounts in 2000 and 1994 include write-offs of acquired in-process research and
development of $30.1 million and $116.4 million, respectively. The amount in 2000 also includes a charitable contribution of $25 million to the Amgen Foundation. See Notes 4
and 11 to the Consolidated Financial Statements for a discussion of the amounts in 2000, 1999, and 1998. Other items, net, increased/(decreased) earnings per share by $0.00
in 2000, $0.03 in 1999, $0.01 in 1998, ($0.09) in 1997, ($0.10) in 1994, $0.01 in 1993, $0.04 in 1992, and ($0.08) in 1991.
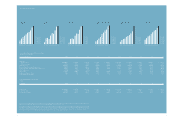
Selected Financial Information
2 3
Total Revenues
($ in millions)
98
00 $3,629.4
99 $3,340.1
98 $2,718.2
97 $2,401.0
96 $2,239.8
95 $1,939.9
94 $1,647.9
93 $1,373.8
92 $1,093.0
91 $ 682.0
99 0097969594939291
Net Income
($ in millions)
98
00 $1,138.5
99 $1,096.4
98 $ 863.2
97 $ 644.3
96 $ 679.8
95 $ 537.7
94 $ 319.7
93 $ 383.3
92 $ 357.6
91 $ 97.9
99 0097969594939291
Diluted EPS
98
00 $1.05
99 $1.02
98 $0.82
97 $0.59
96 $0.61
95 $0.48
94 $0.29
93 $0.33
92 $0.30
91 $0.08
99 0097969594939291
Research and Development Expenses
($ in millions)
98
00 $845.0
99 $822.8
98 $663.3
97 $630.8
96 $528.3
95 $451.7
94 $323.6
93 $255.3
92 $182.3
91 $120.9
99 0097969594939291
Stockholders’ Equity
($ in millions)
98
00 $4,314.5
99 $3,023.5
98 $2,562.2
97 $2,139.3
96 $1,906.3
95 $1,671.8
94 $1,274.3
93 $1,172.0
92 $ 933.7
91 $ 531.1
99 0097969594939291
Amgen Staff
98
00 7,326
99 6,355
98 5,585
97 5,372
96 4,709
95 4,084
94 3,396
93 3,109
92 2,363
91 1,751
99 0097969594939291