American Express 2001 Annual Report Download - page 69
Download and view the complete annual report
Please find page 69 of the 2001 American Express annual report below. You can navigate through the pages in the report by either clicking on the pages listed below, or by using the keyword search tool below to find specific information within the annual report.-
 1
1 -
2
-
3
-
4
-
5
-
6
-
7
-
8
-
9
-
10
-
11
-
12
-
13
-
14
-
15
-
16
-
17
-
18
-
19
-
20
-
21
-
22
-
23
-
24
-
25
-
26
-
27
-
28
-
29
-
30
-
31
-
32
-
33
-
34
-
35
-
36
-
37
-
38
-
39
-
40
-
41
-
42
-
43
-
44
-
45
-
46
-
47
-
48
-
49
-
50
-
51
-
52
-
53
-
54
-
55
-
56
-
57
-
58
-
 59
59 -
 60
60 -
 61
61 -
 62
62 -
 63
63 -
 64
64 -
 65
65 -
 66
66 -
 67
67 -
 68
68 -
 69
69 -
 70
70 -
 71
71 -
 72
72 -
 73
73 -
 74
74 -
 75
75 -
 76
76 -
 77
77 -
 78
78 -
 79
79 -
80
-
81
-
82
-
83
-
84
 |
 |

axp_67
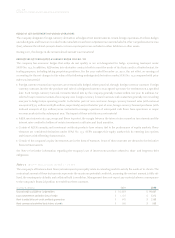
NOTES TO CONSOLIDATED FINANCIAL STATEMENTS
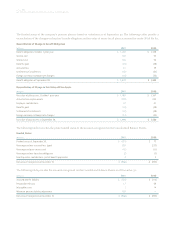
The company has elected to follow APB Opinion No. 25, “Accounting for Stock Issued to Employees,” and related Interpretations
in accounting for its employee stock options. Therefore, no compensation cost has been recognized related to stock options. If the
company had elected to account for its stock options under the fair value method of SFAS No. 123, “Accounting for Stock-Based
Compensation,” the company’s net income and earnings per common share would have been reduced to the pro forma amounts
indicated below:
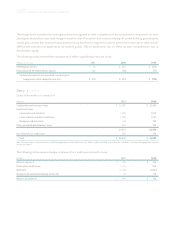
(Millions, except per share amounts) 2001 2000 1999
Net income:
As reported $ 1,311 $ 2,810 $ 2,475
Pro forma $ 1,074 $ 2,616 $ 2,348
Basic EPS:
As reported $ 0.99 $ 2.12 $ 1.85
Pro forma $ 0.81 $ 1.97 $ 1.75
Diluted EPS:
As reported $ 0.98 $ 2.07 $ 1.81
Pro forma $ 0.80 $ 1.92 $ 1.71
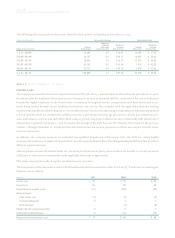
The fair value of each option is estimated on the date of grant using a Black-Scholes option-pricing model with the following
weighted average assumptions used for grants in 2001, 2000 and 1999, respectively:
2001 2000 1999
Dividend yield 0.8% 1.1% 1.5%
Expected volatility 31% 29% 30%
Risk-free interest rate 4.9% 6.7% 5.1%
Expected life of stock option 5 years 5 years 5 years
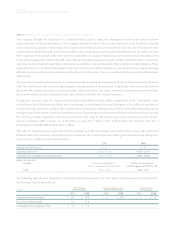
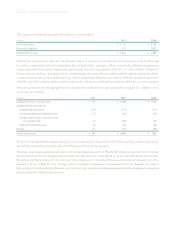
The dividend yield reflects the assumption that the current dividend payout will continue with no anticipated increases. The
expected life of the options is based on historical data and is not necessarily indicative of exercise patterns that may occur. The
weighted average fair value per option was $14.69, $14.92 and $11.09 for options granted during 2001, 2000 and 1999,respectively.
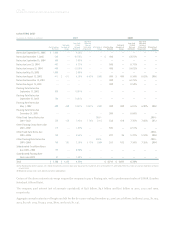
A summary of the status of the company’s stock option plans as of December 31 and changes during each of the years then ended
is presented below:
(Shares in thousands) 2001 2000 1999
Weighted Weighted Weighted
Average Average Average
Shares Exercise Price Shares Exercise Price Shares Exercise Price
Outstanding at beginning of year 114,460 $ 34.23 94,512 $ 27.96 76,658 $ 21.49
Granted 42,883 $ 44.21 39,273 $ 44.38 36,529 $ 36.53
Exercised (5,649) $ 20.83 (14,114) $ 19.45 (16,033) $ 16.20
Forfeited/Expired (5,625) $ 40.64 (5,211) $ 36.87 (2,642) $ 29.82
Outstanding at end of year 146,069 $ 37.42 114,460 $ 34.23 94,512 $ 27.96
Options exercisable at end of year 49,428 $ 29.08 33,966 $ 23.61 32,476 $ 18.70