American Eagle Outfitters 2001 Annual Report Download - page 4
Download and view the complete annual report
Please find page 4 of the 2001 American Eagle Outfitters annual report below. You can navigate through the pages in the report by either clicking on the pages listed below, or by using the keyword search tool below to find specific information within the annual report.-
 1
1 -
 2
2 -
 3
3 -
 4
4 -
 5
5 -
 6
6 -
 7
7 -
 8
8 -
 9
9 -
 10
10 -
 11
11 -
 12
12 -
 13
13 -
 14
14 -
 15
15 -
16
-
17
-
18
-
19
-
20
-
21
-
22
-
23
-
24
-
25
-
26
-
27
-
28
-
29
-
30
-
31
-
32
-
33
-
34
-
35
-
36
-
37
-
38
-
39
-
40
-
41
-
42
-
43
-
44
-
45
-
46
-
47
-
48
-
49
-
50
-
51
-
52
-
53
-
54
-
55
-
56
-
57
-
58
 |
 |

24
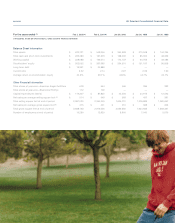
For the years ended (1) Feb 2, 2002(2) Feb 3, 2001(2) Jan 29, 2000 Jan 30, 1999 Jan 31, 1998
in thousands, except per share amounts, ratios and other financial information
Summary of Operations
Net sales $1,371,899 $1,093,477 $832,104 $587,600 $405,713
U.S. comparable store sales increase (3) 2.3% 5.8% 20.9% 32.1% 15.1%
Gross profit $547,368 $436,225 $356,508 $234,511 $136,967
Gross profit as a percentage of net sales 39.9% 39.9% 42.8% 39.9% 33.8%
Operating income $166,473 $146,551 $149,514 $87,053 $31,120
Operating income as a percentage of net sales 12.1% 13.4% 18.0% 14.8% 7.7%
Net income $105,495 $93,758 $90,660 $54,118 $19,537
Net income as a percentage of net sales 7.7% 8.6% 10.9% 9.2% 4.8%
Per Share Results
Basic income per common share $1.47 $1.35 $1.30 $0.80 $0.29
Diluted income per common share $1.43 $1.30 $1.24 $0.75 $0.29
Weighted average common shares
outstanding—basic 71,529 69,652 69,555 67,921 66,272
Weighted average common shares
outstanding—diluted 73,797 72,132 73,113 71,928 68,449
(1) Except for the fiscal year ended February 3, 2001, which includes 53 weeks, all fiscal years presented include 52 weeks. (2) Includes the results of operations,
beginning October 29, 2000, for the divisions of Dylex Limited purchased by the Company as discussed in Note 3 of the Consolidated Financial Statements.
(3) The U.S. comparable store sales increase for the period ended February 3, 2001 was compared to the corresponding 53-week period in the prior year. (4) Net
sales per average square foot is calculated using retail sales for the year divided by the straight average of the beginning and ending square footage for the year.
AE Selected Consolidated Financial Data