Allegheny Power 2011 Annual Report Download - page 2
Download and view the complete annual report
Please find page 2 of the 2011 Allegheny Power annual report below. You can navigate through the pages in the report by either clicking on the pages listed below, or by using the keyword search tool below to find specific information within the annual report.-
 1
1 -
 2
2 -
 3
3 -
 4
4 -
 5
5 -
 6
6 -
 7
7 -
 8
8 -
 9
9 -
 10
10 -
 11
11 -
 12
12 -
 13
13 -
14
-
15
-
16
-
17
-
18
-
19
-
20
-
21
-
22
-
23
-
24
-
25
-
26
-
27
-
28
-
29
-
30
-
31
-
32
-
33
-
34
-
35
-
36
-
37
-
38
-
39
-
40
-
41
-
42
-
43
-
44
-
45
-
46
-
47
-
48
-
49
-
50
-
51
-
52
-
53
-
54
-
55
-
56
-
57
-
58
-
59
-
60
-
61
-
62
-
63
-
64
-
65
-
66
-
67
-
68
-
69
-
70
-
71
-
72
-
73
-
74
-
75
-
76
-
77
-
78
-
79
-
80
-
81
-
82
-
83
-
84
-
85
-
86
-
87
-
88
-
89
-
90
-
91
-
92
-
93
-
94
-
95
-
96
-
97
-
98
-
99
-
100
-
101
-
102
-
103
-
104
-
105
-
106
-
107
-
108
-
109
-
110
-
111
-
112
-
113
-
114
-
115
-
116
-
117
-
118
-
119
-
120
-
121
-
122
-
123
-
124
-
125
-
126
-
127
-
128
-
129
-
130
-
131
-
132
-
133
-
134
-
135
-
136
-
137
-
138
-
139
-
140
-
141
-
142
-
143
-
144
-
145
-
146
-
147
-
148
-
149
-
150
-
151
-
152
-
153
-
154
-
155
-
156
-
157
-
158
-
159
-
160
-
161
-
162
-
163
-
164
-
165
-
166
-
167
-
168
-
169
-
170
-
171
-
172
-
173
-
174
-
175
-
176
-
177
-
178
-
179
-
180
 |
 |

2
FINANCIAL HIGHLIGHTS
KEY ACCOMPLISHMENTS
› Maintained annual dividend of $2.20 per share
› Provided a total shareholder return of nearly
26 percent
› Generated $3.1 billion in cash from operations
› Reduced debt by $2.4 billion
› Captured approximately $270 million in annual
merger-related savings
› Our competitive subsidiary, FirstEnergy Solutions
(FES), achieved a nearly 27 percent increase in
the number of customers served
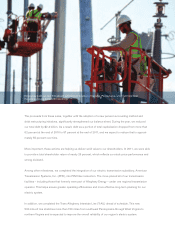
On the cover: We replaced the reactor vessel head at our Davis-Besse Nuclear Power Station in Oak Harbor, Ohio,
ensuring the plant will continue to provide safe and reliable electricity into the future.
TOTAL REVENUES
NET INCOME
BOOK VALUE per common share
DILUTED EARNINGS per common share
BASIC EARNINGS per common share
NET CASH FROM OPERATING ACTIVITIES
DIVIDENDS PAID per common share
FINANCIALS AT A GLANCE
(Dollars in millions, except per share amounts)
$16,258
$869
$2.22
$2.21
$2.20
$31.75
$3,063
2011
$13,339
$718
$2.44
$2.42
$2.20
$29.47
$3,076
2010
$12,973
$856
$2.87
$2.85
$2.20
$29.58
$2,465
2009
Note: All periods reflect the retrospective application of FirstEnergy’s election to change its accounting for pensions
and other post-employment benefits (OPEB), effective in 2011.
FES CUSTOMERS
SERVED
(In millions)
1.8 (2 011)
1.5 (2010)
0.6 (2009)
0.5 11.5 20
FES COMPETITIVE
RETAIL SALES
(In millions of megawatt-hours)
63.2 (2011)
39.2 (2010)
10.7 (2009)
10 20 30 40 6050 70 800
GENERATION OUTPUT
(In millions of megawatt-hours)
106 (2 011)
75 (2010)
66 (2009)
20 40 60 80 100 1200