Air Canada 2007 Annual Report Download - page 7
Download and view the complete annual report
Please find page 7 of the 2007 Air Canada annual report below. You can navigate through the pages in the report by either clicking on the pages listed below, or by using the keyword search tool below to find specific information within the annual report.-
 1
1 -
 2
2 -
 3
3 -
 4
4 -
 5
5 -
 6
6 -
 7
7 -
 8
8 -
 9
9 -
 10
10 -
 11
11 -
 12
12 -
 13
13 -
 14
14 -
 15
15 -
 16
16 -
 17
17 -
 18
18 -
19
-
20
-
21
-
22
-
23
-
24
-
25
-
26
-
27
-
28
-
29
-
30
-
31
-
32
-
33
-
34
-
35
-
36
-
37
-
38
-
39
-
40
-
41
-
42
-
43
-
44
-
45
-
46
-
47
-
48
-
49
-
50
-
51
-
52
-
53
-
54
-
55
-
56
-
57
-
58
-
59
-
60
-
61
-
62
-
63
-
64
-
65
-
66
-
67
-
68
-
69
-
70
-
71
-
72
-
73
-
74
-
75
-
76
-
77
-
78
-
79
-
80
-
81
-
82
-
83
-
84
-
85
-
86
-
87
-
88
-
89
-
90
-
91
-
92
-
93
-
94
-
95
-
96
-
97
-
98
-
99
-
100
-
101
-
102
-
103
-
104
-
105
-
106
-
107
-
108
-
109
-
110
-
111
-
112
-
113
-
114
-
115
-
116
-
117
-
118
-
119
-
120
-
121
-
122
-
123
-
124
-
125
-
126
-
127
-
128
-
129
-
130
-
131
-
132
-
133
-
134
-
135
-
136
-
137
-
138
-
139
-
140
-
141
-
142
-
143
-
144
 |
 |

Management’s Discussion and Analysis of Results and Financial Condition
7
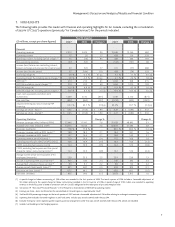
1. HIGHLIGHTS
The following table provides the reader with fi nancial and operating highlights for Air Canada, excluding the consolidation
of Jazz Air LP (“Jazz”) operations (previously “Air Canada Services”) for the periods indicated.
($ millions, except per share fi gures)
Fourth Quarter Year
2007 2006 Change $ 2007 2006 Change $
Financial
Operating revenues 2,513 2,423 90 10,646 10,164 482
Operating income 72 (5 ) 77 433 114 319
Operating income, excluding special charges (1) 72 (13 ) 85 433 236 197
Non-operating expenses (52 ) (52 ) - (122 ) (191 ) 69
Income (loss) before non-controlling interest,
foreign exchange and provision for income taxes
20 (57 ) 77 311 (77 ) 388
Income (loss) for the period 35 (144 ) 179 429 (74 ) 503
Operating margin % 2.9 % -0.2 % 3.1 pp 4.1 % 1.1 % 3.0 pp
Operating margin %, excluding special charges (1) 2.9 % -0.5 % 3.4 pp 4.1 % 2.3 % 1.8 pp
EBITDAR (2) 274 213 61 1,263 948 315
EBITDAR, excluding special charges (1) (2) 274 205 69 1,263 1,070 193
EBITDAR margin % 10.9 % 8.8 % 2.1 pp 11.9 % 9.3 % 2.6 pp
EBITDAR margin %, excluding special charges (1) 10.9 % 8.5 % 2.4 pp 11.9 % 10.4 % 1.5 pp
Cash, cash equivalents and short-term
investments 1,239 2,110 (871 ) 1,239 2,110 (871 )
Free cash fl ow (892 ) (365 ) (527 ) (2,233 ) (652 ) (1,581 )
Adjusted debt/equity ratio, excluding PDP
fi nancing 65.4 % 65.7 % (0.3 ) pp 65.4% 65.7 % (0.3 ) pp
Earnings per share - basic (3) $ 0.35 $ (1.55 ) $ 1.90 $ 4.29 $ (0.83 ) $ 5.12
Earnings per share - diluted (3) $ 0.35 $ (1.55 ) $ 1.90 $ 4.27 $ (0.83 ) $ 5.10
Operating Statistics Change % Change %
Revenue passenger miles (millions) (RPM) 11,446 11,160 2.6 50,629 48,993 3.3
Available seat miles (millions) (ASM) 14,715 14,343 2.6 62,814 61,083 2.8
Passenger load factor 77.8 % 77.8 % - 80.6 % 80.2 % 0.4 pp
Passenger revenue yield per RPM (cents) (4) 18.9 18.5 2.1 18.4 18.1 1.6
Passenger revenue per ASM (cents) (4) 14.7 14.4 2.1 14.8 14.5 2.1
Operating revenue per ASM (cents) (4) 17.0 16.9 0.4 17.0 16.6 1.9
Operating expense per ASM ("CASM") (cents) 16.6 16.9 (2.0 ) 16.3 16.5 (1.2 )
CASM, excluding fuel expense (cents) 12.4 12.9 (3.5 ) 12.2 12.3 (0.8 )
CASM, excluding fuel expense and the special
charge for labour restructuring (cents) (1) 12.4 12.9 (3.9 ) 12.2 12.3 (0.4 )
Average number of full-time equivalent (FTE)
employees (thousands) 23.9 23.3 2.5 23.9
23.6 1.3
Aircraft in operating fl eet at period end (5) 340 332 2.4 340 332 2.4
Average fl eet utilization (hours per day) (6) 9.3 9.1 2.2 9.8 9.5 3.2
Average aircraft fl ight length (miles) (6) 851 847 0.5 874 873 0.1
Fuel price per litre (cents) (7) 67.5 64.1 5.3 65.6 66.2 (1.0 )
Fuel litres (millions) 905 906 (0.1 ) 3,873 3,813 1.6
(1) A special charge for labour restructuring of $28 million was recorded in the fi rst quarter of 2006. The fourth quarter of 2006 includes a favourable adjustment of
$8 million relating to the special charge for labour restructuring recorded in the fi rst quarter of 2006. A special charge of $102 million was recorded to operating
revenues in the third quarter of 2006 in connection with Air Canada’s obligation for the redemption of pre-2002 Aeroplan miles.
(2) See section 19 "Non-GAAP Financial Measures" in this MD&A for a reconciliation of EBITDAR to operating income.
(3) Earnings per share – basic and diluted are the consolidated Air Canada fi gures as reported under GAAP.
(4) Yield and RASM percentage changes for the fourth quarter of 2007 exclude a favourable adjustment of $26 million relating to a change in accounting estimates.
(5) Operating fl eet excludes chartered freighters in 2007 and 2006. Includes Jazz aircraft covered under the Jazz CPA.
(6) Excludes third party carriers operating under capacity purchase arrangements other than Jazz aircraft covered under the Jazz CPA (which are included).
(7) Includes fuel handling and fuel hedging expenses.