Adaptec 2001 Annual Report Download - page 21
Download and view the complete annual report
Please find page 21 of the 2001 Adaptec annual report below. You can navigate through the pages in the report by either clicking on the pages listed below, or by using the keyword search tool below to find specific information within the annual report.-
 1
1 -
2
-
3
-
4
-
5
-
6
-
7
-
8
-
9
-
10
-
 11
11 -
 12
12 -
 13
13 -
 14
14 -
 15
15 -
 16
16 -
 17
17 -
 18
18 -
 19
19 -
 20
20 -
 21
21 -
 22
22 -
 23
23 -
 24
24 -
 25
25 -
 26
26 -
 27
27 -
 28
28 -
 29
29 -
 30
30 -
 31
31 -
32
-
33
-
34
-
35
-
36
-
37
-
38
-
39
-
40
-
41
-
42
-
43
-
44
-
45
-
46
-
47
-
48
-
49
-
50
-
51
-
52
-
53
-
54
-
55
-
56
-
57
-
58
-
59
-
60
-
61
-
62
-
63
-
64
-
65
-
66
-
67
-
68
-
69
-
70
-
71
-
72
-
73
-
74
-
75
-
76
-
77
-
78
-
79
-
80
-
81
-
82
-
83
-
84
-
85
-
86
-
87
-
88
-
89
-
90
-
91
-
92
-
93
 |
 |

21
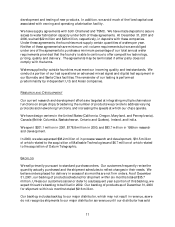
Other Costs and Expenses ($000,000)
Research and Development Expenses
Our research and development, or R&D, expenses were $201.1 million in 2001, $178.8 million in
2000, and $83.7 million in 1999, an increase of 12% in 2001 compared to 2000 and an increase of
114% in 2000 compared to 1999.
R&D expenses for 2001 were higher than 2000 as the effect of increased hiring and expansion of
development programs and costs during 2000 was only partially offset by the restructuring and
cost reduction programs implemented in 2001. (See “ Restructuring and other special charges” .)
Although w e implemented two restructuring plans during the first and fourth quarters of 2001,
our total R& D expenses increased because we had made substantial additions to our personnel
and tools during the latter part of 2000 and we have realized less than 3 months’ savings from
our fourth-quarter restructuring. While we reduced our R&D personnel by 34% by the end of
2001 from the end of 2000, our personnel and related costs for 2001 exceeded 2000 by
approximately $7.2 million. We also increased our tools and equipment costs by $11.8 million
due to our continued investment in new tools and equipment in support of our continuing
research and development efforts.
Our 2001 R&D expenses also increased by $4.2 million as a result of acquisitions that w e
completed during 2000 and accounted for under the purchase method.
2001 Change 2000 Change 1999
Research and development $201.1 12% $178.8 114% $83.7
Percentage of net revenues 62% 26% 28%
Marketing, general and administrative $90.3 (10%) $100.6 92% $52.3
Percentage of net revenues 28% 14% 18%
A
mortization of deferred stock compensation:
Research and development 32.5$ 1% 32.3$ 773% 3.7$
Marketin
g
,
g
eneral and administrative 8.7 118% 4.0 186% 1.4
41.2$ 13% 36.3$ 612% 5.1$
Percentage of net revenues 13% 5% 2%
Amortization of goodwill $44.0 $36.4 $1.9
Percentage of net revenues 14% 5% 1%
Costs of merger - $38.0 $0.9
Percentage of net revenues - 5% -
In process research and development - $38.2 -
Percentage of net revenues - 5% -
Restructuring costs and other special charges $195.2 - -
Percentage of net revenues 60% - -
Impairment of goodwill and purchased intangible assets $269.8 - -
Percentage of net revenues 84% - -