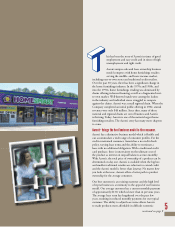
Aarons 2011 Annual Report Download - page 17
Download and view the complete annual report
Please find page 17 of the 2011 Aarons annual report below. You can navigate through the pages in the report by either clicking on the pages listed below, or by using the keyword search tool below to find specific information within the annual report.-
 1
1 -
2
-
3
-
4
-
5
-
6
-
 7
7 -
 8
8 -
 9
9 -
 10
10 -
 11
11 -
 12
12 -
 13
13 -
 14
14 -
 15
15 -
 16
16 -
 17
17 -
 18
18 -
 19
19 -
 20
20 -
 21
21 -
 22
22 -
 23
23 -
 24
24 -
 25
25 -
 26
26 -
 27
27 -
28
-
29
-
30
-
31
-
32
-
33
-
34
-
35
-
36
-
37
-
38
-
39
-
40
-
41
-
42
-
43
-
44
-
45
-
46
-
47
-
48
-
49
-
50
-
51
-
52
 |
 |

Year Ended Year Ended Increase/(Decrease) % Increase/
December 31, December 31, in Dollars to 2011 (Decrease) to
(In Thousands) 2011 2010 from 2010 2011 from 2010
REVENUES:
Lease Revenues and Fees $1,516,508 $1,402,053 $114,455 8.2%
Retail Sales 38,557 40,556 (1,999) (4.9)
Non-Retail Sales 389,960 362,273 26,687 7.4
Franchise Royalties and Fees 63,255 59,112 4,143 7.0
Other 16,769 12,853 3,916 30.5
2,024,049 1,876,847 147,202 7.8
COSTS AND EXPENSES:
Retail Cost of Sales 22,738 23,013 (275) (1.2)
Non-Retail Cost of Sales 353,745 330,918 22,827 6.9
Operating Expenses 872,248 824,929 47,319 5.7
Lawsuit Expense 36,500 — 36,500 —
Depreciation of Lease Merchandise 550,732 504,105 46,627 9.2
Interest 4,709 3,096 1,613 52.1
1,840,672 1,686,061 154,611 9.2
Earnings Before Income Taxes 183,377 190,786 (7,409) (3.9)
Income Taxes 69,610 72,410 (2,800) (3.9)
Net Earnings $ 113,767 $ 118,376 $ (4,609) (3.9)%
are expected to be recovered or settled. Valuation allowances are
established, when necessary, to reduce deferred tax assets when we
expect the amount of tax benefit to be realized is less than the car-
rying value of the deferred tax asset.
Fair Value. For the valuation techniques used to determine the
fair value of our call option on our PerfectHome investment and
assets held for sale, refer to Note A and Note P in the Consolidated
Financial Statements.
RESULTS OF OPERATIONS
Year Ended December 31, 2011 Versus Year Ended
December 31, 2010
For the years ended December 31, 2011 and 2010, the Company’s
Sales and Lease Ownership, Franchise and HomeSmart segments
accounted for substantially all of the operations of the Company
and, therefore, unless otherwise noted only the material changes are
discussed within these three segments. The entire production of our
Manufacturing segment, consisting of our Woodhaven Furniture
Industries operation, is leased or sold through our stores, and con-
sequently that segment’s revenues and earnings before income taxes
are eliminated through the elimination of intersegment revenues and
intersegment profit.
Legal Reserves. We are subject to various legal claims arising in
the ordinary course of business. Management regularly assesses the
Company’s insurance deductibles, analyzes litigation information with
the Company’s attorneys and evaluates its loss experience. We accrue
for litigation loss contingencies that are both probable and reasonably
estimable. Legal fees and expenses associated with the defense of all of
our litigation are expensed as such fees and expenses are incurred.
Income Taxes. The calculation of our income tax expense requires
significant judgment and the use of estimates. We periodically assess
tax positions based on current tax developments, including enacted
statutory, judicial and regulatory guidance. In analyzing our overall
tax position, consideration is given to the amount and timing of rec-
ognizing income tax liabilities and benefits. In applying the tax and
accounting guidance to the facts and circumstances, income tax bal-
ances are adjusted appropriately through the income tax provision.
Reserves for income tax uncertainties are maintained at levels we
believe are adequate to absorb probable payments. Actual amounts
paid, if any, could differ significantly from these estimates.
We use the liability method of accounting for income taxes.
Under this method, deferred tax assets and liabilities are recognized
for the future tax consequences attributable to differences between
the financial statement carrying amounts of existing assets and
liabilities and their respective tax basis. Deferred tax assets and
liabilities are measured using enacted tax rates expected to apply to
taxable income in the years in which those temporary differences
15