AT&T Uverse 2015 Annual Report Download - page 16
Download and view the complete annual report
Please find page 16 of the 2015 AT&T Uverse annual report below. You can navigate through the pages in the report by either clicking on the pages listed below, or by using the keyword search tool below to find specific information within the annual report.-
 1
1 -
2
-
3
-
4
-
5
-
 6
6 -
 7
7 -
 8
8 -
 9
9 -
 10
10 -
 11
11 -
 12
12 -
 13
13 -
 14
14 -
 15
15 -
 16
16 -
 17
17 -
 18
18 -
 19
19 -
 20
20 -
 21
21 -
 22
22 -
 23
23 -
 24
24 -
 25
25 -
 26
26 -
27
-
28
-
29
-
30
-
31
-
32
-
33
-
34
-
35
-
36
-
37
-
38
-
39
-
40
-
41
-
42
-
43
-
44
-
45
-
46
-
47
-
48
-
49
-
50
-
51
-
52
-
53
-
54
-
55
-
56
-
57
-
58
-
59
-
60
-
61
-
62
-
63
-
64
-
65
-
66
-
67
-
68
-
69
-
70
-
71
-
72
-
73
-
74
-
75
-
76
-
77
-
78
-
79
-
80
-
81
-
82
-
83
-
84
-
85
-
86
-
87
-
88
 |
 |

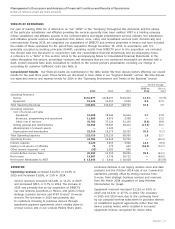
Management’s Discussion and Analysis of Financial Condition and Results of Operations (continued)
Dollars in millions except per share amounts
14
|
AT&T INC.
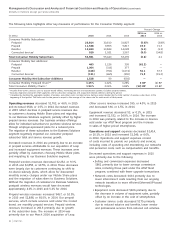
Business Solutions
Segment Results
Percent Change
2015 vs. 2014 vs.
2015 2014 2013 2014 2013
Segment operating revenues
Wireless service $30,687 $30,182 $29,696 1.7% 1.6%
Fixed strategic services 10,910 9,666 8,444 12.9 14.5
Legacy voice and data services 18,019 19,857 21,669 (9.3) (8.4)
Other service and equipment 3,558 3,860 3,878 (7.8) (0.5)
Wireless equipment 7,953 7,041 3,960 13.0 77.8
Total Segment Operating Revenues 71,127 70,606 67,647 0.7 4.4
Segment operating expenses
Operations and support 44,946 45,826 43,442 (1.9) 5.5
Depreciation and amortization 9,789 9,355 8,965 4.6 4.4
Total Segment Operating Expenses 54,735 55,181 52,407 (0.8) 5.3
Segment Operating Income 16,392 15,425 15,240 6.3 1.2
Segment Contribution $16,392 $15,425 $15,240 6.3% 1.2%
The following table highlights other key measures of performance for the Business Solutions segment:
Percent Change
2015 vs. 2014 vs.
(in 000s) 2015 2014 2013 2014 2013
Business Wireless Subscribers
Postpaid 48,290 45,160 40,811 6.9% 10.7%
Reseller 85 11 (1) — —
Connected devices1 25,284 19,943 16,326 26.8 22.2
Total Business Wireless Subscribers 73,659 65,114 57,136 13.1 14.0
Business Wireless Net Additions2
Postpaid 1,203 2,064 1,381 (41.7) 49.5
Reseller 13 6 — — —
Connected devices1 5,315 3,439 2,032 54.6 69.2
Business Wireless Net Subscriber Additions 6,531 5,509 3,413 18.6 61.4
Business Wireless Postpaid Churn2,3 0.99% 0.90% 0.89% 9 BP 1 BP
Business IP Broadband Connections 911 822 631 10.8 30.3
Business IP Broadband Net Additions 89 191 327 (53.4)% (41.6)%
1
Includes data-centric devices such as session-based tablets, monitoring devices and automobile systems. Excludes postpaid tablets.
2 Excludes migrations between AT&T segments and/or subscriber categories and acquisition-related additions during the period.
3
Calculated by dividing the aggregate number of wireless subscribers who canceled service during a period divided by the total number of wireless subscribers at the
beginning of that period. The churn rate for the period is equal to the average of the churn rate for each month of that period.
using official exchange rates. Our International segment is
subject to foreign currency fluctuations.
Our operating assets are utilized by multiple segments and
consist of our wireless and wired networks as well as an
international satellite fleet. We manage our assets to provide
for the most efficient, effective and integrated service to our
customers, not by operating segment, and therefore asset
information and capital expenditures by operating segment
are not presented. Depreciation is allocated based on network
usage or asset utilization by segment.
We discuss capital expenditures in “Liquidity and Capital
Resources.”
located in the U.S. or in U.S. territories. We utilize our
U.S.wireless network to provide voice and data services,
including high-speed Internet, video entertainment and
home monitoring services.
The International segment accounted for approximately 3%
of our 2015 total segment operating revenues. This segment
provides entertainment services in Latin America and
wireless services in Mexico. Video entertainment services are
provided to primarily residential customers using satellite
technology. We utilize our regional and national networks
in Mexico to provide consumer and business customers
with wireless data and voice communication services.
Our international subsidiaries conduct business in their local
currency and operating results are converted to U.S. dollars