Peachtree 2010 Annual Report Download
Download and view the complete annual report
Please find the complete 2010 Peachtree annual report below. You can navigate through the pages in the report by either clicking on the pages
listed below, or by using the keyword search tool below to find specific information within the annual report.
-

1
-

2
-

3
-

4
-
5
-
6
-
7
-
8
-

9
-

10
-
11
-

12
-
13
-
14
-
15
-
16
-
17
-
18
-
19
-
20
-
21
-
22
-
23
-
24
-
25
-
26
-
27
-
28
-
29
-
30
-
31
-
32
-
33
-
34
-
35
-
36
-
37
Table of contents
-
Page 1
-
Page 2
-
Page 3
Year ended 30 September 2010
2010 Revenue - Organic - Headline P t profit Pre-tax fit - Including FY09 restructuring costs g FY09 restructuring g costs - Excluding Earnings per share - Including FY09 restructuring costs - Excluding FY09 restructuring costs Operating cash flow/EBITA†Full year ...
-
Page 4
-
Page 5
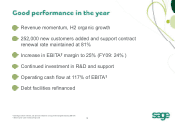
... momentum, H2 organic growth • 252,000 new customers added d and support contract renewal rate maintained at 81% % • Increase in EBITA†margin to 25% 2 (FY09: 24%*) • Continued investment in R&D and support pp • Operating cash flow at 117% of o EBITA†• Debt facilities refinanced...
-
Page 6
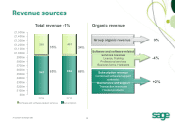
...%
Software and software-related services revenue
Licence, Training Professional services Business forms, Hardware
-4%
941
65%
954
66%
Subscription revenue Combined software/support contracts M i t Maintenance and d support t Transaction revenues Hosted products
+2%
At constant exchange rates...
-
Page 7
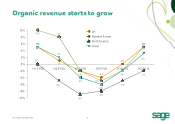
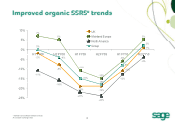
10%
10% 8%
UK Mainland Europe North America
8% 6% 4%
2% 5%
Group
5%
2%
0%
0% -2% -4% H1 FY08
1%
0%
3%
H2 FY08
H1 FY09
-2% -4%
H2 FY09
-4% -5%
H1 FY10
-2%
H2 FY10
-2%
-6% -8%
-5% -6% -8%
-5%
-10%
-9%
At constant exchange rates
7
-
Page 8
... FY08
-4%
H1 FY09
H2 FY09
H1 FY10
-6%
H2 FY10
-4%
-8% -8% 8% -11% -15% % -15% -16% -18% 18% -19% -22% -24% -19% -13% -11% 11%
-15% -20% -25%
* Software and software-related services At constant exchange rates
8
-
Page 9
• Renewal rates maintained at 81% • Combined software and service contrac cts now 68% of total
100% 90% 80% 70% 60% 50% 40% 30% 20% 10% 0% FY05 FY06 FY07 FY Y08 FY09 FY10 41
Basic Combined
47 59
41
3 36
33
32
53
59
6 64
67
68
9
-
Page 10
...year)
25.5%
23%
22%
24.2% 22.4%
• One time cost in FY09 associated i t d with ith th these savings = £26.1m • In FY10 we invested £22.7m, and achieved a further £12.7m of savings
21%
20%
Reported EBITA margin FY09 FY09 cost of restructuring EBITA margin FY09 excluding restructuring FY10...
-
Page 11
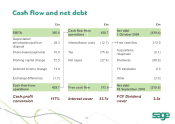
... Depreciation/ amortisation/profit on disposal Share-based payments Working capital change Deferred income change Exchange differences Cash flow from operations 365.8 28.3 10.0 12.5 13 8 13.8 (1.7) 428.7 Free cash flow Cash flow fro om operations Interest/issue costs Tax Net capex
£m 428.7 (12...
-
Page 12
... EBITDA
Balance sheet £m
Goodwill and intangible assets Property plant and equipment Property, Net deferred income tax Net working capital Deferred income Current income tax liabilities Retirement benefit obligations Derivative financial instruments
Sept 2010
2,210.2 149 6 149.6 (29.2) 30.0 (402...
-
Page 13
-
Page 14
...of 3% in improving market (H2: 5% growth)
- - - - - Subscription +6% Software and software-related software related services -5% 5% Sage 50 performed well with 3% growth Sage Pay continued to grow strongly at 29% %, with increasing mid-market mid market presence Products and services for accountants...
-
Page 15
... 3% Software and software-related services -1% France performed well with 3% organic revenue growth, th with ith good d performance f in i ERP products y Spanish business contracted 4% organically in year but returned to growth in H2 Germany grew by 2% organically, with strong upgrade performance...
-
Page 16
... market Sage Payment Solutions Division flat organically. Cross-sell gaining traction Sage Healthcare S H lth Di Division i i contracted t t d 5% organically. Impact of stimulus expected from April 2011 onwards
37% margin
FY09
Sage Healthcare Division Sage Payment Solutions Division Sage Business...
-
Page 17
...at 11%, with good performance from accounting and payroll solutions solutions. Acquired Netcash in May 2010 • Australia grew 4% with strong performance by Handisoft • Smaller Asian businesses declined 3%, although good performance in Middle East and dM Malaysia l i • EBITA margin 25% (FY09: 24...
-
Page 18
-
Page 19
• We have added 800,000 customers • Maintenance and support contr ract renewal rates maintained at 81% • We have increased underlying y g EPS by y 18% • We have g generated operating p g cash c flow of 114% of EBITA over the period, enabling g rapid pay down of debt
19 9
-
Page 20
• Strong leadership team across business • Products and services well pos sitioned • Customer C stomer service ser ice levels le els high • Sage brand is strong and gettin ng stronger
20 0
-
Page 21
• Customers buying from trusted d brands • Customers focus on improving g their own efficiency • Channel remains key in mid-m market • Sage well positioned to help SMEs S take advantage of the web
21 1
-
Page 22
• Market led • Local L lf focus l leads d t to organisatio i tion structure t t • Unique internal culture
• Sage principles • Leadership standards • Customer experience • Sage as an employer brand
22 2
-
Page 23
The Sage S Group plc Guy Be erruyer CE EO
North America Sue Swenson Pascal Houillon (mid 2011)
Northern Europe Paul Stobart
Southern Europe Ãlvaro RamÃrez
Africa, Australia, Asia & Middle East Ivan Epstein
Strategy & Corporate Development David Clayton
Group Finance Director Paul Harrison
...
-
Page 24
• Organic revenue growth, partic cularly in North America, including Healthcare Division • Driving margins in the medium term • How Sage leverages the web including SaaS • M&A remains on the agenda
24 4
-
Page 25
• Challenging markets but positiv ve growth signs H2 • Main M i objective bj ti f for 2011 i is retur t rn to t growth th • Driving progress across range of initiatives
Premium support Product positioning g Channel reinvigoration Connected services
25 5
-
Page 26
... products
Revenue £74.8m 48% of total £59.7m 38% of total £22.7m 14% of total £157 2m £157.2m
Organic c revenue e growth h +6% 6% %
• Focus F on sales l execution ti • Targeting key specialities • Strong g management g team
-14% 14% %
-19% 19% %
Total
-5% 5% %
At constant exchange...
-
Page 27
• Dual approach: • Connected services for our existing products and customer base • Online business solutions, including i SaaS • Good progress in delivering solutions • As a trusted partner to SMEs, SMEs w we are well positioned to bring SMEs the benefits of th he web
27 7
-
Page 28
HR Advice Sage 100 Anywhere
Netcash h SalesLogix
Cl d Editi Cloud Edition
e-Filing Fili
Sage Fundraising Online
28 8
-
Page 29
• Key assets, including our decentralised model and business partner channel • Clear priorities • New highly energised executive team
29 9
-
Page 30
-
Page 31
-
Page 32
Revenue FY10 £m UK Mainland Europe North America Rest of World Total 248.1 511.4 549.9 125.6 1 435 0 1,435.0
FY10 revenue % of Group 17% 36% 38% 9% 100%
EBITA FY10 £m 88.9 123.5 121.6 31.8 365 8 365.8
EBITA margin FY10 % 36% 24% 22% 25% 25%
32 2
-
Page 33
R Revenue Subscription Software and software-related services Total £180.6m £67.5m £ £248.1m EBITA margin EBITA
EBITA £88.9m
36%
Customers New in the year At 30 September 2010 32,000 835,000
Support contracts 4,000 364,000
33 3
-
Page 34
R Revenue Subscription Software and software-related services Total £295.4m £216.0m £511.4m EBITA margin EBITA
EBITA £123.5m
24%
Customers New in the year At 30 September 2010 50,000 1,726,000
Support contracts 28,000 680,000
34 4
-
Page 35
R Revenue Subscription Software and software-related services Total £415.9m £134.0m £ £549.9m EBITA margin EBITA
EBITA £121.6m
22%
Cus stomers* New in the year At 30 September 2010 123,000 3,241,000
Support contracts 32,000 633,000
* Excluding ACT!
35 5
-
Page 36
R Revenue Subscription Software and software-related services Total £61.6m £64.0m £ £125.6m EBITA margin EBITA
EBITA £31.8m
25%
Customers New in the year At 30 September 2010 51,000* 596,000
Support contracts 19,000* 185,000
* Includes 4,000 from the acquisition of Netcash
36 6
-
Page 37
The Sage Group plc
North Park Newcastle upon Tyne NE13 9AA United Kingdom Telephone +44 (0)191 294 3000 Facsimile +44 (0)191 294 0002 www.sage.com