Graco 2012 Annual Report Download
Download and view the complete annual report
Please find the complete 2012 Graco annual report below. You can navigate through the pages in the report by either clicking on the pages listed below, or by using the keyword search tool below to find specific information within the annual report.-
 1
1 -
 2
2 -
 3
3 -
 4
4 -
 5
5 -
 6
6 -
 7
7 -
 8
8 -
 9
9 -
 10
10 -
 11
11 -
 12
12 -
13
-
14
-
15
-
16
-
17
-
18
-
19
-
20
-
21
-
22
-
23
-
24
-
25
-
26
-
27
-
28
-
29
-
30
-
31
-
32
-
33
-
34
-
35
-
36
-
37
-
38
-
39
-
40
-
41
-
42
-
43
-
44
-
45
-
46
-
47
-
48
-
49
-
50
-
51
-
52
-
53
-
54
-
55
-
56
-
57
-
58
-
59
-
60
-
61
-
62
-
63
-
64
-
65
-
66
-
67
-
68
-
69
-
70
-
71
-
72
-
73
-
74
-
75
-
76
-
77
-
78
-
79
-
80
-
81
-
82
-
83
-
84
-
85
-
86
-
87
-
88
-
89
-
90
-
91
-
92
-
93
-
94
-
95
-
96
-
97
-
98
-
99
-
100
-
101
-
102
-
103
-
104
-
105
-
106
-
107
-
108
-
109
-
110
-
111
-
112
-
113
-
114
-
115
-
116
-
117
-
118
 |
 |

2012 ANNUAL REPORT
Table of contents
-
Page 1
2012 ANNUAL REPORT -
Page 2
...base BABY & PAREnTinG EndiCiA MiMiO 5 WAYs TO Win MAKE OuR BRAnds REALLY MATTER Sharpen brand strategies on highest impact growth levers Partner to win with customers and suppliers BuiLd An EXECuTiOn POWERHOusE Launch new USA customer development organization Develop joint business plans for new... -
Page 3
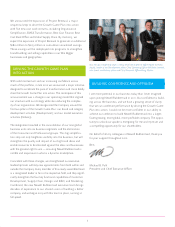
...2012, Newell Rubbermaid delivered solid results while simultaneously driving significant change as we deployed the first stage of the Growth Game Plan...build our Company into a larger, fastergrowing, more global, more profitable Newell Rubbermaid. Michael B. Polk President and Chief Executive Officer... -
Page 4
... & Parenting segment began to reap the benefits of new product innovation and a more strategic approach to customer partnerships, growing core sales nearly 10 percent with excellent margin improvement. Core growth in emerging markets reached nearly 12 percent in 2012, with growth in Latin America of... -
Page 5
...capabilities of Customer Development, Supply Chain, Design and R&D, and Marketing. Combined, the new Newell Rubbermaid executive team brings decades of experience to our shared vision of building a better company, and we began 2013 with this team in place, running at full speed. BUILDING CONFIDENCE... -
Page 6
... to parents worldwide. sPeciAlTY The technology and hardware brands of our Specialty business segment offer unique solutions to consumers at home and at work. Dymo provides businesses and consumers innovative ways to manage and organize information, while Endicia offers online mailing solutions to... -
Page 7
... There were 286.4 million shares of the Registrant's Common Stock outstanding (net of treasury shares) as of January 31, 2013. The aggregate market value of the shares of Common Stock (based upon the closing price on the New York Stock Exchange on June 30, 2012) beneficially owned by non-affiliates... -
Page 8
... AND SERVICES PART IV ITEM 15. EXHIBITS, FINANCIAL STATEMENT SCHEDULES SIGNATURES Statement of Computation of Earnings to Fixed Charges Significant Subsidiaries Consent of Independent Registered Public Accounting Firm 302 Certification of Chief Executive Officer 302 Certification of Chief Financial... -
Page 9
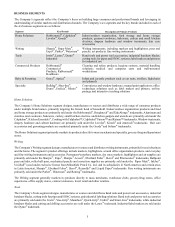
... and Exchange Commission. GENERAL Newell Rubbermaid is a global marketer of consumer and commercial products that help people flourish every day, where they live, learn, work and play. The Company's products are marketed under a strong portfolio of leading brands, including Rubbermaid®, Levolor... -
Page 10
... to decision support, transaction processing and information management by leveraging SAP and the streamlined business segments to align resources with the Growth Game Plan. Best Cost Back Office: The Company will drive "One Newell Rubbermaid" efficiencies in customer and consumer services and... -
Page 11
... Infant and juvenile products such as car seats, strollers, highchairs and playards Convenience and window hardware; manual paint applicators; office technology solutions such as label makers and printers, on-line postage and interactive teaching solutions Baby & Parenting Specialty Home Solutions... -
Page 12
... home centers, commercial products distributors, select contract customers and other professional customers. Baby & Parenting The Company's Baby & Parenting segment designs and distributes infant and juvenile products such as swings, highchairs, car seats, strollers and playards, and primarily sells... -
Page 13
... purchase on a "just-in-time" basis in order to reduce inventory carrying costs and increase returns on investment. As retailers shorten their lead times for orders, manufacturers and suppliers need to more closely anticipate consumer buying patterns. The Company supports its retail customers... -
Page 14
.../Competition The Company's principal customers are large mass merchandisers, such as discount stores, home centers, warehouse clubs, office superstores, commercial distributors and e-commerce companies. The rapid growth of large mass merchandisers, together with changes in consumer shopping patterns... -
Page 15
... numerous other manufacturers and distributors of consumer and commercial products, many of which are large and well-established. The Company's principal customers are large mass merchandisers, such as discount stores, home centers, warehouse clubs, office superstores, commercial distributors and... -
Page 16
... its manufacturing operations to gain efficiencies, reduce supply chain costs and streamline or redeploy nonstrategic selling, general and administrative expenses in order to produce products at a best-cost position and allow the Company to invest in innovation and brand building. In October 2011... -
Page 17
...long-term contracts with its suppliers or sourcing partners. Most raw materials and sourced goods are obtained on a "purchase order" basis; however, in limited cases where the Company has supply contracts with fixed prices, the Company may be required to purchase raw materials at above-market prices... -
Page 18
... decline in the Company's stock price. The Company continues to evaluate the impact of economic and other developments on the Company and its business units to assess whether impairment indicators are present. Accordingly, the Company may be required to perform impairment tests based on changes in... -
Page 19
... recommendations to buy, sell or hold the Company's securities, and each rating should be evaluated independently of any other rating. The level of returns on pension and postretirement plan assets and the actuarial assumptions used for valuation purposes could affect the Company's earnings and cash... -
Page 20
... in use are generally in good condition, well-maintained, and are suitable and adequate to carry on the Company's business. OWNED OR LEASED BUSINESS SEGMENT LOCATION CITY GENERAL CHARACTER HOME SOLUTIONS WRITING TOOLS COMMERCIAL PRODUCTS OH KS OH Canada MO OH OH Mexico NC UT IL Canada IL... -
Page 21
BUSINESS SEGMENT LOCATION CITY OWNED OR LEASED GENERAL CHARACTER BABY & PARENTING SPECIALTY CORPORATE SHARED FACILITIES Brazil Brazil Netherlands PA Japan Germany Poland China China WI IN Mexico Belgium CT MA WA CA GA Canada Switzerland France China Australia Italy CA GA IL NC UK ... -
Page 22
... manufacturer and marketer of power tools and accessories), culminating as Vice President and General Manager of Product Service. Mark S. Tarchetti has been Executive Vice President and Chief Development Officer since January 2013. From September 2011 to December 2012, Mr. Tarchetti was the Director... -
Page 23
....49) and 7,361 shares (average price: $21.90), respectively, in connection with vesting of employees' stock-based awards. Under the SRP, the Company may repurchase its own shares of common stock through a combination of a 10b5-1 automatic trading plan, discretionary market purchases or in privately... -
Page 24
... with, the Consolidated Financial Statements of the Company included elsewhere in this report and the schedules thereto. 2012(1) 2011(1) 2010(1) (2) 2009(2) 2008(2) STATEMENTS OF OPERATIONS DATA Net sales Cost of products sold Gross margin Selling, general and administrative expenses Impairment... -
Page 25
...obligations at closing. Aprica is a Japanese brand of premium strollers, car seats and other related juvenile products. The acquisition provides the opportunity for the Company's Baby & Parenting business to broaden its presence worldwide, including expanding the scope of Aprica's sales outside Asia... -
Page 26
... Summaries Summarized quarterly data for the last two years is as follows (in millions, except per share data) (unaudited): Calendar Year 1st(1) 2nd(1) 3rd 4th Year 2012 Net sales Gross margin Income from continuing operations Income from discontinued operations Net income Earnings per share: Basic... -
Page 27
...Consolidated Financial Statements and Notes thereto. Business Overview Newell Rubbermaid is a global marketer of consumer and commercial products that help people flourish every day, where they live, learn, work and play. The Company's products are marketed under a strong portfolio of leading brands... -
Page 28
... to decision support, transaction processing and information management by leveraging SAP and the streamlined business segments to align resources with the Growth Game Plan. Best Cost Back Office: The Company will drive "One Newell Rubbermaid" efficiencies in customer and consumer services and... -
Page 29
... Infant and juvenile products such as car seats, strollers, highchairs and playards Convenience and window hardware; manual paint applicators; office technology solutions such as label makers and printers, on-line postage and interactive teaching solutions Baby & Parenting Specialty Market... -
Page 30
... in the Tools, Writing and Commercial Products segments to drive greater sales penetration, enhance the availability of products and to support geographic expansion; Supported new innovations in the Baby & Parenting segment, including the Graco® Fast-Action and Ready2Grow™ travel systems, which... -
Page 31
... a distribution center consolidation in the Home Solutions segment as well as a project to align the Home Solutions segment's sales and marketing organizations with the Company's newly created Customer Development Organization. In the Tools and the Commercial Products segments, the Company began... -
Page 32
... Game Plan - Brand & Category Development and Market Execution & Delivery. The Company is also migrating multiple legacy systems and users to a common SAP global information platform in a phased, multi-year rollout. SAP is expected to enable the Company to integrate and manage its worldwide business... -
Page 33
... 25.8% of net sales, or $1,515.3 million, for 2011. In constant currency, SG&A expenses increased $32.6 million, primarily due to $37.1 million of incremental investments in brand building and strategic SG&A activities to support new products, marketing initiatives, new market entries and global... -
Page 34
... incremental investments in brand building and other strategic SG&A activities to support marketing initiatives, advertising and promotions, new market entries and global expansion. SG&A expenses for 2011 include $6.3 million of incremental costs incurred due to the Company's Chief Executive Officer... -
Page 35
... Statements for further information. Business Segment Operating Results: 2012 vs. 2011 Business Segment Operating Results Net sales by segment were as follows for the years ended December 31, (in millions, except percentages): 2012 2011 % Change Home Solutions Writing Tools Commercial Products Baby... -
Page 36
... million for 2011. Core sales increased 7.0% driven by the introduction of new products in North America and continued investment in sales forces in international markets. Excluding the impacts of foreign currency, sales at the segment's North American and international businesses increased 6.6% and... -
Page 37
... (loss) by segment was as follows for the years ended December 31, (in millions, except percentages): 2011 2010 % Change Home Solutions Writing Tools Commercial Products Baby & Parenting Specialty Impairment charges Restructuring costs Corporate(3) Total operating income NMF - Not meaningful figure... -
Page 38
... of sales shifted from 2011 to the fourth quarter of 2010 due to customer order acceleration to qualify for annual volume rebates. Excluding the impacts of currency, sales at the segment's North American businesses remained unchanged while sales increased 2.0% at international businesses. Foreign... -
Page 39
... a percentage of net sales. Liquidity and Capital Resources Cash Flows Cash and cash equivalents increased (decreased) as follows for the years ended December 31, (in millions): 2012 2011 2010 Cash provided by operating activities Cash used in investing activities Cash used in financing activities... -
Page 40
... and warrant transactions during 2010. Uses Historically, the Company's primary uses of liquidity and capital resources have included dividend payments, share repurchases, capital expenditures, payments on debt and acquisitions. During 2012, the Company retired $250.0 million outstanding principal... -
Page 41
... based on historical trends, due to inventory build-ups early in the year for seasonal sales activity and credit terms provided to customers. For 2012, the increase in accounts receivable days is attributable to the timing of sales in the fourth quarter of 2012 compared to the fourth quarter of 2011... -
Page 42
...receivable balances due to the timing of sales in the fourth quarter of 2012 compared to the same quarter in 2011 and lower combined levels of short-term and current portion of long-term debt, partially offset by an increase in accounts payable. • The Company monitors its overall capitalization by... -
Page 43
... nature of its business. The volume and timing of production impacts the Company's cash flows and has historically involved increased production in the first quarter of the year to meet increased customer demand through the remainder of the year. Working capital fluctuations have historically... -
Page 44
... repurchase program (the "SRP"). Under the SRP, the Company may repurchase its own shares of common stock through a combination of a 10b5-1 automatic trading plan, discretionary market purchases or in privately negotiated transactions. The SRP is authorized to run for a period of three years ending... -
Page 45
... to the Company's selfinsurance programs, including workers' compensation, product liability and medical. See Footnote 20 of the Notes to Consolidated Financial Statements for further information. As of December 31, 2012, the Company did not have any significant off-balance sheet arrangements, as... -
Page 46
... four reporting units were as follows: Writing & Creative Expression; Commercial Products; Technology; and Industrial Products & Services. The Company conducts its annual test of impairment of goodwill as of the first day of the third quarter because it generally coincides with its annual strategic... -
Page 47
...a discount rate based on an estimate of a reasonable risk-adjusted return an investor would expect to realize on an investment in the reporting unit. In using the discounted cash flow approach to value the Technology reporting unit in 2012, the Company used an average compound long-term sales growth... -
Page 48
... and competitive conditions, the impact of the economic environment on the Company's customer base and net sales, a material negative change in its relationships with significant customers, or sustained declines in the Company's market capitalization relative to its reported stockholders' equity... -
Page 49
... cash flows using a discount rate required for a similar investment of like risk and records an impairment charge as the difference between the fair value and the carrying value of the asset group. Generally, the Company performs its testing of the asset group at the product-line level, as this... -
Page 50
... expected return on plan assets, mortality rates and rate of compensation increases, as discussed below: • Discount rates: The Company generally estimates the discount rate for its pension and other postretirement benefit obligations using an iterative process based on a hypothetical investment in... -
Page 51
... in discount rates, actual returns on plan assets and changes in the actuarially determined life of the plans impact the amount of unrecognized gain (loss) recognized as expense annually. Recent Accounting Pronouncements See Item 8 of Part II, "Financial Statements and Supplementary Data-Footnote... -
Page 52
... Reform Act of 1995. Such forward-looking statements may relate to, but are not limited to, information or assumptions about the effects of sales (including pricing), income/(loss), earnings per share, return on equity, return on invested capital, operating income, operating margin or gross margin... -
Page 53
... innovative new products and to develop, maintain and strengthen its end-user brands; the Company's ability to expeditiously close facilities and move operations while managing foreign regulations and other impediments; the Company's ability to implement successfully information technology solutions... -
Page 54
... for the year ended December 31, (in millions, except percentages): Market Risk(1) Interest rates Foreign exchange (1) 2012 Average December 31, 2012 2011 Average December 31, 2011 Confidence Level $ $ 6.6 9.7 $ $ 2.9 6.0 $ $ 10.3 11.8 $ $ 10.6 15.5 95% 95% The Company generally does not... -
Page 55
..., as of December 31, 2012, the Company's internal control over financial reporting is effective based on those criteria. The Company's independent registered public accounting firm, Ernst & Young LLP, has audited the financial statements prepared by the management of Newell Rubbermaid Inc. and the... -
Page 56
REPORT OF INDEPENDENT REGISTERED PUBLIC ACCOUNTING FIRM The Board of Directors and Stockholders of Newell Rubbermaid Inc. We have audited the accompanying consolidated balance sheets of Newell Rubbermaid Inc. and subsidiaries as of December 31, 2012 and 2011, and the related consolidated statements ... -
Page 57
... respects, effective internal control over financial reporting as of December 31, 2012, based on the COSO criteria. We also have audited, in accordance with the standards of the Public Company Accounting Oversight Board (United States), the consolidated balance sheets of Newell Rubbermaid Inc. and... -
Page 58
NEWELL RUBBERMAID INC. AND SUBSIDIARIES CONSOLIDATED STATEMENTS OF OPERATIONS (Amounts in millions, except per share data) Year Ended December 31, 2012 2011 2010 Net sales Cost of products sold Gross margin Selling, general and administrative expenses Impairment charges Restructuring costs ... -
Page 59
NEWELL RUBBERMAID INC. AND SUBSIDIARIES CONSOLIDATED STATEMENTS OF COMPREHENSIVE INCOME (Amounts in millions) Year Ended December 31, 2012 2011 2010 Net income Other comprehensive income (loss), net of tax: Foreign currency translation adjustments Change in unrecognized pension and other ... -
Page 60
...00 par value Outstanding shares, before treasury: 2012 - 304.7 2011 - 305.3 Treasury stock, at cost: Shares held: 2012 - 17.8 2011 - 17.0 Additional paid-in capital Retained earnings Accumulated other comprehensive loss Stockholders' Equity Attributable to Parent Stockholders' Equity Attributable to... -
Page 61
NEWELL RUBBERMAID INC. AND SUBSIDIARIES CONSOLIDATED STATEMENTS OF CASH FLOWS (Amounts in millions) Year Ended December 31, 2012 2011 2010 Operating Activities: Net income Adjustments to reconcile net income to net cash provided by operating activities: Depreciation and amortization Impairment ... -
Page 62
... dividends on common stock Stock-based compensation and other Settlement of call options Settlement of warrants Common stock issued for convertible notes exchange Retirement of common stock purchased under the ASB Extinguishment of equity component of convertible notes Balance at December 31, 2010... -
Page 63
...®. The Company's multi-product offering consists of well-known, name-brand consumer and commercial products in six business segments: Home Solutions; Writing; Tools; Commercial Products; Baby & Parenting; and Specialty. Principles of Consolidation The Consolidated Financial Statements include the... -
Page 64
... cash flows using a discount rate required for a similar investment of like risk and records an impairment charge as the difference between the fair value and the carrying value of the asset group. Generally, the Company performs its testing of the asset group at the product-line level, as this... -
Page 65
... 2012, 2011 and 2010, respectively. Derivative Financial Instruments Derivative financial instruments are generally used to manage certain commodity, interest rate and foreign currency risks. These instruments primarily include interest rate swaps, forward exchange contracts and options. The Company... -
Page 66
... accrued liabilities in the Consolidated Balance Sheets based on the maturity of the Company's forward contracts at December 31, 2012 and 2011. The earnings impact of cash flow hedges relating to forecasted purchases of inventory is generally reported in cost of products sold to match the underlying... -
Page 67
... on a straight-line basis over the requisite service period of the award, which is generally three to five years for stock options and one to three years for restricted stock units and performance-based restricted stock units. The Company estimates future forfeiture rates based on its historical... -
Page 68
... three-year share repurchase program (the "SRP"). Under the SRP, the Company may repurchase its own shares of common stock through a combination of a 10b5-1 automatic trading plan, discretionary market purchases or in privately negotiated transactions. The SRP is authorized to run for a period... -
Page 69
... investment in growth platforms within the business. In connection with the program, the Company consolidated three operating groups into two and 13 global business units into nine. In addition, the Company consolidated a limited number of manufacturing facilities and distribution centers as part... -
Page 70
... for Project Renewal for 2012 and 2011 aggregated by reportable business segment (in millions): December 31, 2011 Balance December 31, 2012 Balance Segment Home Solutions Writing Tools Commercial Products Baby & Parenting Specialty Corporate $ $ 7.1 1.4 - - 2.0 2.4 2.8 15.7 $ Provision... -
Page 71
...connection with the European Transformation Plan are reported in the Company's Corporate segment and were $18.8 million and $18.9 million in 2012 and 2011, respectively, while restructuring charges in 2010 were not material. Restructuring provisions were determined based on estimates prepared at the... -
Page 72
... for Project Acceleration aggregated by reportable business segment for the years ended December 31, (in millions): Since inception through December 31, 2010 Segment 2010 Home Solutions Writing Tools Commercial Products Baby & Parenting Specialty Corporate $ $ 6.6 23.7 7.3 1.6 8.1 - 30.1 77... -
Page 73
... indicated, aggregated by reportable business segment (in millions): Segment Home Solutions Writing Tools Commercial Products Baby & Parenting Specialty Corporate $ 2012 $ 7.6 2.4 1.0 5.6 0.9 3.4 35.2 56.1 $ 2011 $ 7.8 1.9 - - 2.4 3.7 34.3 50.1 $ 2010 $ 6.6 23.7 7.3 1.6 8.1 - 30.1 77... -
Page 74
... by reportable business segment is as follows for 2012 and 2011 (in millions): December 31, 2011 Balance Impairment Charges (2) Other Adjustments (1) Foreign Currency December 31, 2012 Balance (2) Segment Acquisitions Home Solutions Writing Tools Commercial Products Baby & Parenting Specialty... -
Page 75
... periods using the straight-line method for other intangible assets, including capitalized software, as of December 31, 2012: Weighted-Average Amortization Period (in years) Amortization Periods (in years) Trade names - indefinite life Trade names - other Capitalized software Patents Customer lists... -
Page 76
..., given to customers in exchange for their selling efforts and volume purchased. The self-insurance accrual is primarily casualty liabilities such as workers' compensation, general and product liability and auto liability and is estimated based upon historical loss experience combined with... -
Page 77
... is included in operating activities in accrued liabilities and other in the Consolidated Statement of Cash Flows for 2011. The medium-term note balances at December 31, 2012 and 2011 include mark-to-market adjustments of $31.7 million and $35.8 million, respectively, to record the fair value of... -
Page 78
... 2020 Notes are classified as long-term debt in the Company's Consolidated Balance Sheet at December 31, 2012 and 2011 based on their maturity date. In connection with the Plan, the Company conducted and completed a cash tender offer (the "Tender Offer") in August 2010 through which it repurchased... -
Page 79
... of the Convertible Notes. Accordingly, the Company's effective interest rate on the Convertible Notes was 10.8%. In connection with the Capital Structure Optimization Plan, in September 2010 the Company completed an exchange of newly issued shares of common stock and cash for $324.7 million of... -
Page 80
....1 million shares of the Company's common stock at a strike price of $8.61 per share, subject to adjustment in certain circumstances, for $69.0 million. The call options generally allowed the Company to receive shares of the Company's common stock from counterparties equal to the number of shares of... -
Page 81
... Balance Sheets as of December 31, 2012 and 2011 (in millions): Assets Derivatives designated as hedging instruments Balance Sheet Location 2012 2011 Balance Sheet Location 2012 Liabilities 2011 Interest rate swaps Foreign exchange contracts on inventoryrelated purchases Foreign exchange contracts... -
Page 82
... Location of gain (loss) recognized in income Amount of gain (loss) reclassified from AOCI into income 2012 2011 2010 Foreign exchange contracts on inventoryrelated purchases Foreign exchange contracts on intercompany borrowings Forward interest rate swaps Commodity swap Cost of products... -
Page 83
... covering substantially all of their international and domestic employees. Plan benefits are generally based on years of service and/or compensation. The Company's funding policy is to contribute not less than the minimum amounts required by the Employee Retirement Income Security Act of 1974, as... -
Page 84
... Consolidated Balance Sheets. The Company has a Supplemental Executive Retirement Plan ("SERP"), which is a nonqualified defined benefit plan pursuant to which the Company will pay supplemental pension benefits to certain key employees upon retirement based upon the employees' years of service and... -
Page 85
... the years ended December 31, (in millions, except percentages): U.S. 2012 2011 2010 2012 International 2011 2010 Service cost-benefits earned during the year Interest cost on projected benefit obligation Expected return on plan assets Amortization of: Prior service cost Actuarial loss Curtailment... -
Page 86
...per share or unit multiplied by the number of shares or units held as of the measurement date. The common/collective trust funds are generally actively managed investment vehicles. Fixed income investments primarily comprise mutual funds and common/collective trust funds that invest in corporate and... -
Page 87
...2012: Target Asset Category U.S. International Equity Fixed income Insurance contracts Cash and equivalents Other investments (1) Total (1) Other investments include private equity funds, hedge funds and real estate funds. 45% 40 5 - 10 100% 23% 14 24 21 18 100% Expected Long-term Rate of Return... -
Page 88
... historical and expected rates of return of the asset classes included in the pension plans' target asset allocations. Other Postretirement Benefit Plans Several of the Company's subsidiaries currently provide retiree health care and life insurance benefits for certain employee groups. The following... -
Page 89
...is developed using a spot interest yield curve based on a broad population of corporate bonds rated AA or higher. The following are the weighted-average assumptions used to determine net periodic benefit cost for the other postretirement benefit plans for the years ended December 31,: 2012 2011 2010... -
Page 90
... below for the years ended December 31, (in millions, except per share data): 2012 2011 2010 Numerator for basic and diluted earnings per share: Income from continuing operations Income (loss) from discontinued operations Net income Dividends and equivalents for share-based awards expected to be... -
Page 91
...based restricted stock units vest and the related stock is issued. In the case of retirement (as defined in the award agreement), awards vest depending on the employee's age and years of service subject to the satisfaction of the applicable performance criteria. Stock Plans The Company's stock plans... -
Page 92
... using the Black-Scholes option pricing model with the following weighted-average assumptions for the years ended December 31,: 2011 2010 Risk-free interest rate Dividend yield Expected volatility Expected life (in years) 2.6% 1.3% 39% 6.4 2.9% 1.4% 38% 6.7 The Company considered the retirement... -
Page 93
... 2012, 2011 and 2010, respectively. During 2012, 2011 and 2010, the Company awarded 1.0 million, 0.5 million and 0.9 million performance-based restricted stock units, respectively, which entitle recipients to shares of the Company's stock at the end of a three-year vesting period if specified market... -
Page 94
... earn shares equal to 100% of the units granted. During 2011, the Company awarded 0.7 million performance-based restricted stock units, which entitle the recipient to shares of the Company's stock if specified market and service conditions are achieved. The performance-based restricted stock units... -
Page 95
... tax rate for the year ended December 31, 2011 was also favorably impacted by a change in the geographical mix in earnings. During 2010, the Company settled its 2005 and 2006 U.S. federal income tax return examinations, including all issues that were at the IRS Appeals Office, and as part of... -
Page 96
...thereon. Upon distribution of those earnings in the form of dividends or otherwise, the Company would be subject to U.S. ...the following for the years ended December 31, (in millions): 2012 2011 2010 Investment activities, including equity in earnings Currency transaction (gain) loss Other $ $ 1.4... -
Page 97
... and included in cash and cash equivalents are not publicly traded, but the fair value is determined based on the values of the underlying investments in the money market fund (Level 2). The Company generally uses derivatives for hedging purposes pursuant to the relevant authoritative guidance... -
Page 98
...- Brand & Category Development and Market Execution & Delivery. As part of the expanded program, the Company's Consumer and Professional groups were eliminated and the Company's nine global business units were streamlined into six business segments. As a result, the 2011 and 2010 segment information... -
Page 99
...office technology solutions such as label makers and printers, on-line postage and interactive teaching solutions The Company's segment and geographic results are as follows as of and for the years ended December 31, (in millions): Net Sales (1) Home Solutions Writing Tools Commercial Products Baby... -
Page 100
2012 2011 2010 Depreciation & Amortization (2) Home Solutions Writing Tools Commercial Products Baby & Parenting Specialty Corporate Capital Expenditures Home Solutions Writing Tools Commercial Products Baby & Parenting Specialty Corporate(3) $ $ $ 29.8 27.0 15.3 25.1 9.9 9.8 46.8 163.7 34.4 ... -
Page 101
... Information (in millions) 2012 2011 2010 Net Sales (1) (5) United States Canada Total North America Europe, Middle East and Africa Latin America Asia Pacific Total International Operating Income (Loss) (2) (6) United States Canada Total North America Europe, Middle East and Africa Latin America... -
Page 102
... Latin America Asia Pacific Total International 2012 2011 2010 $ $ $ (266.8) $ - (266.8) (9.2) - (106.6) (115.8) (382.6) $ $ The following table summarizes the net sales by product grouping for the years ended December 31, (in millions): 2012 2011 2010 Home Solutions: Rubbermaid... -
Page 103
... improper storage of hazardous materials at the Company's tool manufacturing facility located in Sao Paulo, Brazil. The Company has obtained a stay of enforcement of a notice of fine due October 1, 2009 issued by the Sao Paulo G&E Office. The Company plans to continue to contest the fines. The... -
Page 104
...quarter ended December 31, 2012 that have materially affected, or are reasonably likely to materially affect, the Company's internal control over financial reporting. The Company is in the process of replacing various business information systems worldwide with an enterprise resource planning system... -
Page 105
...and "Information Regarding Board of Directors and Committees and Corporate Governance," which information is incorporated by reference herein. Information required under this Item with respect to Executive Officers of the Company is included as a supplemental item at the end of Part I of this report... -
Page 106
...is a list of the financial statements of Newell Rubbermaid Inc. included in this report on Form 10-K, which are filed herewith pursuant to Item 8: Report of Independent Registered Public Accounting Firm Consolidated Statements of Operations - Years Ended December 31, 2012, 2011 and 2010 Consolidated... -
Page 107
... such document upon the request of the Commission. ITEM 10 - MATERIAL CONTRACTS 10.1* Newell Rubbermaid Inc. Management Cash Bonus Plan, effective January 1, 2008 (incorporated by reference to Exhibit 10.1 to the Company's Current Report on Form 8-K dated February 13, 2008, File No. 001-09068). 101 -
Page 108
...Form of Stock Option Agreement for Chief Executive Officer under Newell Rubbermaid Inc. 2003 Stock Plan, prior to its amendment and restatement effective February 8, 2006 (incorporated by reference to Exhibit 10.6 to the Company's Quarterly Report on Form 10-Q for the quarterly period ended March 31... -
Page 109
... the quarter ended June 30, 2010). 10.24* Form of Restricted Stock Unit Agreement under the 2010 Stock Plan for Non-Employee Directors (incorporated by reference to Exhibit 10.5 to the Company's Quarterly Report on Form 10-Q for the quarterly period ended June 30, 2010). 10.25* Form of Stock Option... -
Page 110
...Agreement and General Release dated November 2, 2012 between Newell Rubbermaid Inc. and Paul Boitmann. 10.39* Retention Agreement dated December 5, 2012 between Newell Rubbermaid Inc. and James M. Sweet. 10.40 Indenture dated as of November 1, 1995, between the Company and The Bank of New York Trust... -
Page 111
... undersigned, thereunto duly authorized. NEWELL RUBBERMAID INC. Registrant By Title Date /s/ Douglas L. Martin Douglas L. Martin Executive Vice President - Chief Financial Officer March 1, 2013 Pursuant to the requirements of the Securities Exchange Act of 1934, this report has been signed below on... -
Page 112
..., Chief Executive Officer and Director Executive Vice President - Chief Financial Officer Vice President - Corporate Controller and Chief Accounting Officer Chairman of the Board and Director Director Director Director Director Director Director Director Director Director Director 106 -
Page 113
...: Year ended December 31, 2012 Year ended December 31, 2011 Year ended December 31, 2010 $ 36.0 $ 43.0 42.2 70.6 $ 63.7 70.4 0.4 $ (0.3) (1.0) (67.2) $ (70.4) (68.6) 39.8 36.0 43.0 (1) Represents accounts written off during the year and cash discounts taken by customers. (in millions) Balance at... -
Page 114
... Of direcTOrs micHaEl T. cOwHiG 2* Chairman of the Board - Newell Rubbermaid Inc. and former President, Global Technical and Manufacturing - The Procter & Gamble Company micHaEl B. POlK President and Chief Executive Officer - Newell Rubbermaid Inc. THOmaS E. claRKE 2, 3, 4* President of New Business... -
Page 115
... the investment of $100 on December 31, 2007 and the reinvestment of dividends. COMPARISON OF CUMULATIVE FIVE YEAR TOTAL RETURN $150 $100 $50 0 2007 2008 Newell Rubbermaid Inc. 2009 2010 S&P 500 Index 2008 2009 $62.61 $ 79.67 $92.03 2011 2012 DJ Consumer Goods Index 2007 Newell Rubbermaid... -
Page 116
...dATA 2012 Sales as Reported writing Segment Tools Segment Baby & Parenting Segment latin america Total company $1,416.2 806.1 736.1 338.9 5,902.7 Currency Impact $ 27.3 28.3 11.1 26.2 91.1 Core Sales* $ 1,443.5 834.4 747.2 365.1 5,993.8 2011 Sales as Reported $ 1,399.3 779.6 680.4 318.6 5,864.6 Year... -
Page 117
... newell rubbermaid is traded on the new York stock exchange under the symbol nwl. Additional copies of this annual report, newell rubbermaid's form 10-K and proxy statement filed with the securities and exchange Commission, dividend reinvestment plan information, financial data and other information... -
Page 118
NEwEll RUBBERmaid iNc., 3 GlENlaKE PaRKwaY, aTlaNTa, Ga 30328 www.NEwEllRUBBERmaid.cOm