Cash America 2005 Annual Report Download
Download and view the complete annual report
Please find the complete 2005 Cash America annual report below. You can navigate through the pages in the report by either clicking on the pages listed below, or by using the keyword search tool below to find specific information within the annual report.-
 1
1 -
 2
2 -
 3
3 -
 4
4 -
 5
5 -
 6
6 -
 7
7 -
 8
8 -
 9
9 -
 10
10 -
 11
11 -
 12
12 -
13
-
14
-
15
-
16
-
17
-
18
-
19
-
20
 |
 |

I n v e s t i n g i n A m e r i c a
Cash America International, Inc.
2005 Annual Report
Table of contents
-
Page 1
Investing in America Cash America International, Inc. 2005 Annual Report -
Page 2
-
Page 3
-
Page 4
-
Page 5
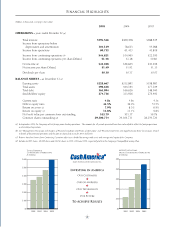
Total Revenue Continuing Operations (in millions) $600 $50 After-Tax Income from Continuing Operations (in millions) Cash America International, Inc. $500 $40 $400 $30 $300 $20 $200 $10 $100 $0 2002 2003 2004 2005 $0 2002 2003 2004 2005 -
Page 6
$90 $75 $60 $45 $30 $15 $0 2002 2003 2004 2005 -
Page 7
-
Page 8
-
Page 9
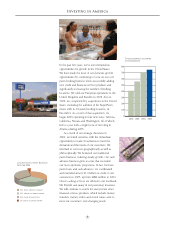
Total Lending Locations at December 31 800 700 600 500 400 300 200 100 0 2002 2003 2004 2005 Composition of Net Revenue Fiscal Year 2005 34% Pawn Service Charges 29% Profit on Merchandise 34% Cash Advance Fees 3% Check Cashing/Other -
Page 10
$300 $250 $200 $150 $100 $50 $0 2001 2002 2003 Pawn Loans 2004 2005 Cash Advances Total Pawn Loans & Cash Advance Dollars Loaned Per Year (in millions) $1,500 $1,200 $900 $600 $300 $0 2002 2003 2004 2005 -
Page 11
-
Page 12
-
Page 13
Pawn Lending Collateral/Merchandise Mix (as of December 31, 2005) 62% Jewelry 15% Electronics 11% Household Items 8% Tools 4% Musical Instruments -
Page 14
-
Page 15
-
Page 16
-
Page 17
-
Page 18
Pre-Tax Income from Continuing Operations (in millions) $80 $70 $60 $50 $40 $30 $20 $10 $0 2002 2003 2004 2005 Earnings Per Share Continuing Operations 2002 2003 2004 2005 Quarterly Comparison of Earnings Per Share Continuing Operations $0.60 $15 Year End Book Value Per Share $0.50 $12 $0.40... -
Page 19
-
Page 20
Cash America International, Inc. 1600 West 7th Street Fort Worth, Texas 76102-2599 (817) 335-1100 www.cashamerica.com