Aarons 1998 Annual Report Download
Download and view the complete annual report
Please find the complete 1998 Aarons annual report below. You can navigate through the pages in the report by either clicking on the pages listed below, or by using the keyword search tool below to find specific information within the annual report.-
 1
1
 |
 |

1
’94
’95
’96
’97
’98
$400,000
350,000
300,000
250,000
200,000
150,000
100,000
50,000
0
($ in 000’s)
Rent-to-Rent Stores
Company-Operated Rental
Purchase Stores
’94
’95
’96
’97
’98
$25,000
20,000
15,000
10,000
5,000
0
($ in 000’s)
Financial Highlights
Year Ended Year Ended
(Dollar Amounts in Thousands, December 31, December 31, Percentage
Except Per Share) 1998 1997 Change
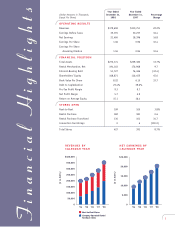
OPERATING RESULTS
Revenues $379,659 $310,751 22.2%
Earnings Before Taxes 35,191 30,237 16.4
Net Earnings 21,484 18,396 16.8
Earnings Per Share 1.06 0.96 10.4
Earnings Per Share
Assuming Dilution 1.04 0.94 10.6
FINANCIAL POSITION
Total Assets $272,174 $239,382 13.7%
Rental Merchandise, Net 194,163 176,968 9.7
Interest-Bearing Debt 51,727 76,486 (32.4)
Shareholders’ Equity 168,871 116,455 45.0
Book Value Per Share 8.22 6.15 33.7
Debt to Capitalization 23.4% 39.6%
Pre-Tax Profit Margin 9.3 9.7
Net Profit Margin 5.7 5.9
Return on Average Equity 15.1 16.4
STORES OPEN
Rent-to-Rent 109 105 3.8%
Rental Purchase 182 181 0.6
Rental Purchase Franchised 136 101 34.7
Convention Furnishings 0 6 (100.0)
Total Stores 427 393 8.7%
REVENUES BY
CALENDAR YEAR
NET EARNINGS BY
CALENDAR YEAR
Table of contents
-
Page 1
Financial Highlights (Dollar Amounts in Thousands, Except Per Share) Year Ended December 31, 1998 Year Ended December 31, 1997 Percentage Change OPERATING RESULTS Revenues Earnings Before Taxes Net Earnings Earnings Per Share Earnings Per Share Assuming Dilution FINANCIAL POSITION $...