3Ware 2011 Annual Report Download
Download and view the complete annual report
Please find the complete 2011 3Ware annual report below. You can navigate through the pages in the report by either clicking on the pages listed below, or by using the keyword search tool below to find specific information within the annual report.-
 1
1 -
 2
2
 |
 |

215 Moffett Park Drive, Sunnyvale, CA 94089 phone 408 542 8600 fax 408 542 8601 apm.com
To: AppliedMicro Stockholders,
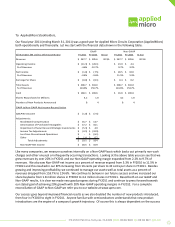
Our scal year 2011 (ending March 31, 2011) was a good year for Applied Micro Circuits Corporaon (AppliedMicro)
both operaonally and nancially. Let me start with the nancial data shown in the following table:
All Numbers $M Unless Otherwise Noted FY 2011 FY 2010 % Incr FY 2011 FY 2010 % Incr
Revenue 247.7$ 205.6$ 20.5% 247.7$ 205.6$ 20.5%
Operating Income (11.3)$ (26.1)$ 23.9$ 4.4$
% of Revenue -4.6% -12.7% 9.7% 2.2%
Net Income (1.0)$ (7.5)$ 28.5$ 10.9$
% of Revenue -0.4% -3.6% 11.5% 5.3%
Earnings Per Share (0.0)$ (0.1)$ 0.4$ 0.2$
Total Assets 308.7$ 316.0$ 308.7$ 316.0$
% of Revenue 124.6% 153.7% 124.6% 153.7%
Cash 168.1$ 206.6$ 16.8$ 206.6$
Shares Repurchased in Millions 4.2 1.8 4.2 1.8
Number of New Products Announced 8 4 8 4
GAAP to Non-GAAP Net Income Reconciliation
GAAP Net Income (1.0)$ (7.5)$
Adjustments:
Stock Based Compensation 16.7$ 13.7$
Amortization of Purchased Intangibles 17.2$ 16.1$
Impairment of Securities and Strategic Investments (5.3)$ 4.9$
Income Tax Adjustments (0.5)$ (10.9)$
Loss from Discontinued Operations -$ (6.1)$
Other 1.4$ 0.7$
Total Adjustments 29.5$ 18.4$
Non-GAAP Net Income 28.5$ 10.9$
GAAP
Non-GAAP
Like many companies, we measure ourselves internally on a Non-GAAP basis which backs out primarily non-cash
charges and other unusual or infrequently occurring transacons. Looking at the above table you can see that we
grew revenues by over 20% in FY2011 and our Non-GAAP operang margin expanded from 2.2% to 9.7% of
revenues. We also saw Non-GAAP net income as a percent of revenue expand from 5.3% in FY2010 to 11.5% in
FY2011 and this resulted in our EPS increasing from 16 cents per share to 42 cents per share in FY2011. Besides
growing and improving protability, we connued to manage our assets well as total assets as a percent of
revenues dropped from 153.7% to 124.6%. We connue to believe in our future success and we increased our
share buybacks from 1.8 million shares in FY2010 to 4.2 million shares in FY2011. Based both on our GAAP and
Non-GAAP results, it is clear we made very good progress during FY2011 and connue to press forward towards
our stated goal of achieving 20% growth with 20% Non-GAAP operang margins in FY2012. For a complete
reconciliaon of GAAP to Non-GAAP we refer you to our website at www.apm.com.
Our success goes beyond improved nancial results as we also doubled the number of new products introduced,
from four in FY2010 to eight in FY2011. Anyone familiar with semiconductors understands that new product
introducons are the engine of a company’s growth trajectory. Of course this is always dependent on the success
Table of contents
-
Page 1
... Loss from Discontinued Operations Other Total Adjustments Non-GAAP Net Income 1.0) $ 16.7 17.2 (5.3) (0.5) 1.4 29.5 28.5 (7.5) FY 2011 $ 247.7 GAAP FY 2010 $ 205.6 % Incr 20.5% FY 2011 $ 247.7 $ $ $ Non-GAAP FY 2010 % Incr $ 205.6 4.4 2.2% 10.9 5.3% 0.2 20.5% $ (11.3) $ (26.1) -4.6% -12... -
Page 2
...25% of the revenues in FY2011 came from new products, which is up from 20% for FY2010 compared on a similar basis. Fiscal year 2011 saw many firsts for AppliedMicro. These include: The acquisition of TPACK, an engineering services company. This acquisition enhances AppliedMicro's transport solutions...