Taco Bell 2010 Annual Report Download
Download and view the complete annual report
Please find the complete 2010 Taco Bell annual report below. You can navigate through the pages in the report by either clicking on the pages listed below, or by using the keyword search tool below to find specific information within the annual report.-
 1
1 -
 2
2 -
 3
3 -
 4
4 -
 5
5 -
 6
6 -
 7
7 -
 8
8 -
 9
9 -
 10
10 -
 11
11 -
 12
12 -
13
-
14
-
15
-
16
-
17
-
18
-
19
-
20
-
21
-
22
-
23
-
24
-
25
-
26
-
27
-
28
-
29
-
30
-
31
-
32
-
33
-
34
-
35
-
36
-
37
-
38
-
39
-
40
-
41
-
42
-
43
-
44
-
45
-
46
-
47
-
48
-
49
-
50
-
51
-
52
-
53
-
54
-
55
-
56
-
57
-
58
-
59
-
60
-
61
-
62
-
63
-
64
-
65
-
66
-
67
-
68
-
69
-
70
-
71
-
72
-
73
-
74
-
75
-
76
-
77
-
78
-
79
-
80
-
81
-
82
-
83
-
84
-
85
-
86
-
87
-
88
-
89
-
90
-
91
-
92
-
93
-
94
-
95
-
96
-
97
-
98
-
99
-
100
-
101
-
102
-
103
-
104
-
105
-
106
-
107
-
108
-
109
-
110
-
111
-
112
-
113
-
114
-
115
-
116
-
117
-
118
-
119
-
120
-
121
-
122
-
123
-
124
-
125
-
126
-
127
-
128
-
129
-
130
-
131
-
132
-
133
-
134
-
135
-
136
-
137
-
138
-
139
-
140
-
141
-
142
-
143
-
144
-
145
-
146
-
147
-
148
-
149
-
150
-
151
-
152
-
153
-
154
-
155
-
156
-
157
-
158
-
159
-
160
-
161
-
162
-
163
-
164
-
165
-
166
-
167
-
168
-
169
-
170
-
171
-
172
-
173
-
174
-
175
-
176
-
177
-
178
-
179
-
180
-
181
-
182
-
183
-
184
-
185
-
186
-
187
-
188
-
189
-
190
-
191
-
192
-
193
-
194
-
195
-
196
-
197
-
198
-
199
-
200
-
201
-
202
-
203
-
204
-
205
-
206
-
207
-
208
-
209
-
210
-
211
-
212
-
213
-
214
-
215
-
216
-
217
-
218
-
219
-
220
-
221
-
222
-
223
-
224
-
225
-
226
-
227
-
228
-
229
-
230
-
231
-
232
-
233
-
234
-
235
-
236
 |
 |
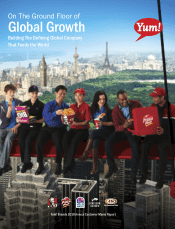
On The Ground Floor of
Global Growth
That Feeds the World
Table of contents
-
Page 1
On The Ground Floor of Global Growth Building The Defining Global Company That Feeds the World Yum! Brands 2010 Annual Customer Mania Report -
Page 2
...Operating Activities (a) See page 29 of our 2010 Form 10-K for further discussion of Special Items. $ 1,404 Average US Sales per System Unit (a) (In thousands) Year-end 2010 2009 2008 2007 2006 5-year growth (b) KFC Pizza Hut Taco Bell (a) Excludes license units. (b) Compounded annual growth rate... -
Page 3
... 1,000 new units. At the same time, we are making major progress building incremental dayparts and sales layers in each of our businesses. We also improved worldwide restaurant margins by 1.3 percentage points, and operating profits grew 15%, prior to foreign currency translation and special items... -
Page 4
... already a truly global growth company, with approximately 65% of our profits coming from outside the United States, including commanding positions in China and the emerging markets. With our leading global brands, 1.4 million system wide team members around the world already operating in over 110... -
Page 5
... our industry. As a result of our learnings, we have a new operating framework we will be executing around the world. We have declared that rigorous execution of our core processes to deliver brand standards is our number one brand building initiative. We realize we need to become a better operating... -
Page 6
#1 Build Leading Brands Across CHINA In Every Significant Category. -
Page 7
... its assets with 24-hour operations, delivery service and continuing to build a solid breakfast business. We also have 520 casual dining Pizza Huts in 130 cities that had a breakout year, generating double digit same store sales growth in every quarter in 2010. Additionally, operating profit grew... -
Page 8
#2 Drive Aggressive INTERNATIONAL Expansion & Build Strong Brands Everywhere. Indonesia -
Page 9
... new growth vehicles by investing in emerging markets like India, Russia and Africa, as well as beginning to develop Taco Bell into a truly global brand. 2010 was a milestone year for our business in India, particularly with the KFC brand. KFC in India surpassed 100 units, had terrific sales growth... -
Page 10
#3 Dramatically Improve US Brand Positions, Consistency and Returns. -
Page 11
... value, Taco Bell offers our customers everyday low prices and an amazing amount of quality food for the money with our "Why Pay More!" menu. This year we successfully introduced $5 boxes and a home-meal replacement option of 12 tacos for just $10. We've also been hard at work to leverage our assets... -
Page 12
#4 Drive Industry-Leading Long-Term shareholder and Franchisee Value. We are extremely proud our share price increased 40% in 2010, rewarding shareholders for our performance in the marketplace. We're also proud we continue to be a leader among consumer companies with Return On Invested Capital (... -
Page 13
... their hard work, dedication and commitment to help build Yum! as the defining Global company that Feeds the World. After reading this Annual Report, I hope you'll agree we're just on the ground floor of global growth! YUM! TO YOU! David C. Novak Chairman & Chief executive officer Yum! Brands, Inc... -
Page 14
-
Page 15
-
Page 16
-
Page 17
...Chairman of the Board and Chief Executive Officer Important Notice Regarding the Availability of Proxy Materials for the Shareholders Meeting to Be Held on May 19, 2011-this Notice and proxy statement is available at www.yum.com/investors/investor_materials.asp and the Annual Report on Form 10-K is... -
Page 18
... as of the close of business on March 21, 2011. You may also read the Company's Annual Report and this Notice and proxy statement on our Web site at www.yum.com/annualreport and www.yum.com/investors/ investor_materials.asp. Annual Report: A copy of our 2010 Annual Report on Form 10-K is included... -
Page 19
...Awards ...Outstanding Equity Awards at Fiscal Year-End ...Option Exercises and Stock Vested ...Pension Benefits ...Nonqualified Deferred Compensation ...Potential Payments Upon Termination or Change in Control ...DIRECTOR COMPENSATION ...EQUITY COMPENSATION PLAN INFORMATION ...AUDIT COMMITTEE REPORT... -
Page 20
... about our directors and most highly paid executive officers. GENERAL INFORMATION ABOUT THE MEETING What is the purpose of the Annual Meeting? At our Annual Meeting, shareholders will vote on several important Company matters. In addition, our management will report on the Company's performance over... -
Page 21
... stock as of the close of business on the record date, March 21, 2011. Each share of YUM common stock is entitled to one vote. As of March 21, 2011, YUM had 466,853,722 shares of common stock outstanding. How does the Board of Directors recommend that I vote? Proxy Statement Our Board of Directors... -
Page 22
... registered directly in your name as the shareholder of record may be voted in person at the Annual Meeting. Shares held in street name may be voted in person only if you obtain a legal proxy from the broker or nominee that holds your shares giving you the right to vote the shares. Even if you plan... -
Page 23
... you contact your broker and/or our transfer agent to consolidate as many accounts as possible under the same name and address. Our transfer agent is American Stock Transfer and Trust Company, LLC, which may be reached at 1(888) 439-4986. Will my shares be voted if I do not provide my proxy? Your... -
Page 24
... ''What other Significant Board Practices does the Company have?-Majority Voting Policy.'' How many votes are needed to approve the other proposals? The ratification of the selection of KPMG LLP as our independent auditors, the approval of the compensation of our named executive officers and the... -
Page 25
...and ten of the Company's twelve directors attended the 2010 Annual Meeting. Proxy Statement How does the Board select nominees for the Board? The Nominating and Governance Committee considers candidates for Board membership suggested by its members and other Board members, as well as management and... -
Page 26
...information and procedures for employees to report ethical or accounting concerns, misconduct or violations of the Code in a confidential manner. The Code of Conduct applies to the Board of Directors and all employees of the Company, including the principal executive officer, the principal financial... -
Page 27
... (to the extent applicable to the Board of Directors or executive officers) on this Web site. What other Significant Board Practices does the Company have? • Private Executive Sessions. Our non-management directors meet in executive session at each regular Board meeting. The executive sessions are... -
Page 28
...designing pay programs at all levels that align team performance, individual performance, customer satisfaction and shareholder return, emphasize long-term incentives and require executives to personally invest in Company stock. In 2011, the Management Planning and Development Committee of the Board... -
Page 29
... of CVS (during 2010, he was also Chief Executive Officer and President of CVS). In 2007, YUM entered into a transaction with CVS to sublease a long range aircraft. In the Fall of 2010, the Company renewed the sublease through 2017. The sublease was renewed at pricing terms substantially similar to... -
Page 30
... on reporting concerns regarding accounting and other matters in addition to our policy on communicating with our non-management directors. Any person, whether or not an employee, who has a concern about the conduct of the Company or any of our people, with respect to accounting, internal accounting... -
Page 31
... the annual audited financial statements and results of the audit with management and the independent auditors • Reviews the Company's accounting and financial reporting principles and practices including any significant changes • Advises the Board with respect to Company policies and procedures... -
Page 32
... of corporate goals set by the Committee • Reviews and approves the compensation of the chief executive officer and other senior executive officers • Reviews management succession planning 5 The Board has determined that all of the members of the Management Planning and Development Committee... -
Page 33
... person is not an executive officer of the other company. During fiscal 2010, affiliates of Harman Management Corporation (''Harman''), as KFC, Taco Bell, Pizza Hut, Long John Silver's and A&W All American Food franchisees, paid royalties of approximately $13.4 million and contingent store opening... -
Page 34
... He served as Non-Executive Chairman of the Board of Motorola, Inc. from May 2008 until the separation of its mobile devices and home businesses in January, 2011. From October 2006 to May 2008, he was Senior Advisor and Managing Director to Warburg Pincus, a global private equity firm. From November... -
Page 35
...as chairman of an international sales and distribution business • Expertise in branding, marketing, sales and international business development • Public company directorship and committee experience • Independent of Company Proxy Statement J. David Grissom Age 72 Director since 2003 Chairman... -
Page 36
... expertise: • Operating and management experience, including as a managing director of a consulting firm and chief executive officer of consumer, branded business • Expertise in finance, strategic planning, marketing, business development and corporate governance • Public company directorship... -
Page 37
... Group. Specific qualifications, experience, skills and expertise: • Operating and management experience, including as president and chief executive officer of a global travel-related services company • Expertise in finance, marketing and international business development • Public company... -
Page 38
...• Operating and management experience, including as chairman and chief executive officer of the Company • Expertise in strategic planning, global branding, franchising, finance and corporate leadership • Public company directorship and committee experience Thomas M. Ryan Age 58 Director since... -
Page 39
... and expertise: • Operating and management experience, including as chief executive officer, of a global healthcare and service provider business • Expertise in finance, business development, business integrations, financial reporting, compliance and controls • Public company directorship and... -
Page 40
... over financial reporting, statutory audits and services rendered in connection with the Company's securities offerings. (2) Audit-related fees for 2010 and 2009 included audits of financial statements of certain employee benefit plans, agreed upon procedures related to certain state tax credits and... -
Page 41
... 2010 and 2009 consisted principally of fees for international tax compliance and tax audit assistance. What is the Company's policy regarding the approval of audit and non-audit services? The Audit Committee has implemented a policy for the pre-approval of all audit and permitted non-audit services... -
Page 42
... vote of a majority of shares present in person or represented by proxy and entitled to vote at the Annual Meeting. While this vote is advisory and non-binding on the Company, the Board of Directors and the Management Planning and Development Committee will review the voting results and consider... -
Page 43
... and non-binding on the Company, the Board of Directors and the Management Planning and Development Committee will carefully consider the outcome of the vote, among other factors, when making future decisions regarding the frequency of advisory votes on executive compensation. What vote is required... -
Page 44
... will incur the costs and disruptions associated with calling and holding a special meeting only if a significant portion of our shareholders support holding such a meeting. The 25% threshold is also consistent with thresholds adopted by many other large public companies. Amendment of Restated... -
Page 45
...at an annual or special meeting called by the Board of Directors to be held within 90 days after the special meeting request is received by the Secretary, (2) the business to be covered at the special meeting was previously included at an annual or special meeting held not more than 12 months before... -
Page 46
... stock. This information is presented as of December 31, 2010, and is based on a stock ownership report on Schedule 13G filed by such shareholder with the SEC and provided to us. Name and Address of Beneficial Owner Number of Shares Beneficially Owned Percent of Class Southeastern Asset Management... -
Page 47
...common stock at year-end and the exercise price divided by the fair market value of the stock). (3) These amounts reflect units denominated as common stock equivalents held in deferred compensation accounts for each of the named persons under our Directors Deferred Compensation Plan or our Executive... -
Page 48
... 1934, as amended, requires our directors, executive officers and persons who own more than 10% of the outstanding shares of YUM common stock to file with the SEC reports of their ownership and changes in their ownership of YUM common stock. Directors, executive officers and greater-than-ten percent... -
Page 49
... in Earnings Per Share (excluding special items) (''EPS'') growth of 17%-marking the ninth consecutive year that we exceeded our annual target of at least 10% • Increased worldwide system sales by 4% (prior to foreign currency translation) • Opened nearly 1,400 new restaurants outside the United... -
Page 50
...Base salary, • Annual performance-based cash incentives, and • Long-term equity compensation consisting of stock-settled stock appreciation rights (''SARs'') and Performance Share Units (''PSUs''). • Pay for Performance. We emphasize pay-for-performance in order to align executive compensation... -
Page 51
...% Salary % Proxy Statement Long Term Equity 48% Annual Incentive % Long Term Equity % Annual Incentive 27% 14MAR201107295253 9MAR201101440694 2010 Compensation Program/Decisions For 2010, we highlighted four major growth strategies as drivers for earnings growth. The Company has communicated... -
Page 52
... results on a year over year basis and the initial impact of expensing stock options in 2005. The special items excluded are the same as those excluded in the Company's annual earning releases. Annual Total Shareholder Return Through 12/31/10 84th percentile 43.3% 9MAR201101 Proxy Statement 94th... -
Page 53
... Base Salary: Based on general economic conditions in 2009, we believed base salaries should not be increased for 2010; • Pay-for-Performance Annual Incentive: Based on our strong 2010 performance, we paid bonuses for 2010 recognizing our strong operating profit growth (prior to special items and... -
Page 54
... pay our restaurant general managers and executives like owners • design pay programs at all levels that align team and individual performance, customer satisfaction and shareholder return • emphasize long-term incentive compensation • require executives to personally invest in Company stock... -
Page 55
... year, the Committee reviews the performance and total compensation of our CEO and the other executive officers. The Committee reviews and establishes each executive's total compensation target for the current year which includes base salary, annual bonus opportunities and long-term incentive awards... -
Page 56
... value from the Company variable pay programs is reflective of business results and not competitive benchmarking. Comparative Compensation Data Revenue size often correlates to some degree with the market value of compensation for senior executive positions. For companies with significant franchise... -
Page 57
...comprising this nondurable consumer products group used for the benchmarking done at the end of 2009 were: 2008 Sales/ Revenues ($billions) 2008 Sales/ Revenues ($billions) Company Name Company Name 9MAR201101440694 Walgreen Co...Lowe's Companies, Inc...PepsiCo, Inc...Kraft Foods, Inc...The Coca... -
Page 58
.... Specific salary increases take into account these factors and the current market for management talent. The Committee reviews each executive officer's salary and performance annually. Based on the economic environment in 2009, the Committee determined not to increase salaries for 2010. While... -
Page 59
... factors that drive individual and team performance, which will result in increased shareholder value over the long term. These measures are designed to align employee goals with the Company's individual divisions' current year objectives to grow earnings and sales, develop new restaurants, improve... -
Page 60
...% 20% 20% 10% 45 5 21 19 90 107 10 117 Proxy Statement Bergren Operating Profit Growth (Before Tax) System Same Store Sales Growth Restaurant Margin System Customer Satisfaction Total Weighted TP Factor-Pizza Hut U.S. 75% Division/25% Yum TP Factor 5% 3.5% 12.0% 61.5% 10.2% 7.7% 12.4% 56% 200... -
Page 61
...individual performance for 2010 was significantly above target based upon Pizza Hut U.S. significantly improving year over year sales and profit growth, as well as his leadership in reshaping the business through improved value, increasing weekday business and improvements in home delivery execution... -
Page 62
...award after vesting. In March 2009, the Committee modified our long-term incentive compensation for our CEO, Chief Financial Officer and our division leaders who report to our CEO by adding a Performance Share Plan and discontinuing the executives' participation in the matching restricted stock unit... -
Page 63
...Committee in determining Mr. Su's 2010 compensation. Mr. Novak's long-term incentive compensation is discussed below. How we Compensate our Chief Executive Officer Comparative Compensation Data for Mr. Novak The discussion of the comparative compensation data and peer group used by the Committee for... -
Page 64
... CEO role relative to other executive roles. This comparative market data analyzed over several years supports the differences in salary, annual incentive payment and long term incentives. Other Benefits Retirement Benefits We offer competitive retirement benefits through the YUM! Brands Retirement... -
Page 65
... on business. There is no incremental cost to the Company for these trips. The incremental cost of the personal use by Mr. Novak is reported on page 54. We do not gross up for taxes on the personal use of the company aircraft. We also pay for the cost of the transmission of home security information... -
Page 66
... included salary, annual incentive award, long-term incentive awards, value of outstanding equity awards (vested and unvested), and lump sum value of pension at retirement and gains realized from exercising stock options. The Committee will continue to review total compensation at least once a year... -
Page 67
... program. The Company's change in control agreements, in general, pay, in case of an executive's termination of employment for other than cause within two years of the change in control, a benefit of two times salary and bonus and provide for a tax gross-up in case of any excise tax. In addition... -
Page 68
...to the new company's future success • supporting the compelling business need to retain key employees during uncertain times • providing a powerful retention device during change in control discussions, especially for more senior executives whose equity awards represents a significant portion of... -
Page 69
... plans qualify as performance-based compensation. For 2010, the annual salary paid to Mr. Novak exceeded one million dollars. The Committee sets Mr. Novak's salary as described above under the heading ''Compensation of Our Chief Executive Officer.'' The other NEOs were in each case paid salaries... -
Page 70
... Discussion and Analysis,'' and, on the basis of that review and discussion, recommended that section be included in our Annual Report on Form 10-K and in this proxy statement. THE MANAGEMENT PLANNING AND DEVELOPMENT COMMITTEE Thomas M. Ryan, Chair David W. Dorman Massimo Ferragamo Bonnie... -
Page 71
... for performance share units (PSUs) granted in 2010 and 2009 and restricted stock units (RSUs) granted in 2010 and 2008 under our Long Term Incentive Plan. Further information regarding the 2010 awards is included in the ''Grants of Plan-Based Awards'' and ''Outstanding Equity Awards at Fiscal Year... -
Page 72
... Data'' of the 2010 Annual Report in Notes to Consolidated Financial Statements at Note 15, ''Share-based and Deferred Compensation Plans.'' Except as provided below and in footnote (2) above, amounts in column (f) reflect the annual incentive awards earned for the 2010, 2009 and 2008 fiscal year... -
Page 73
... payment for foreign service, club dues, tax preparation assistance, Company provided parking, personal use of Company aircraft and annual physical. For Mr. Bergren, this column also includes Company annual contributions of $336,700 to an unfunded, unsecured account based retirement plan called the... -
Page 74
...provides information on stock options, SARs, RSUs and PSUs granted for 2010 to each of the Company's NEOs. The amount of these awards that were expensed is shown in the Summary Compensation Table at page 52. Name (a) Grant Date (b) Estimated Possible Payouts Under Non-Equity Incentive Plan Awards... -
Page 75
... using the Black-Scholes value on the grant date of $8.06. For additional information regarding valuation assumptions of SARs/stock options, see the discussion of stock awards and option awards contained in Part II, Item 8, ''Financial Statements and Supplementary Data'' of the 2010 Annual Report... -
Page 76
... RSUs and PSUs held by the Company's NEOs on December 31, 2010. Option/SAR Awards(1) Stock Awards Equity incentive plan awards: market or payout value of unearned shares, units or other rights that have not vested ($)(3) (i) Name (a) Number of Securities Underlying Unexercised Options/ SARs... -
Page 77
...after 5 years. (3) The market value of these awards are calculated by multiplying the number of shares covered by the award by $49.05, the closing price of YUM stock on the NYSE on December 31, 2010. (4) The awards reflected in this column are unvested performance-based PSUs that are scheduled to be... -
Page 78
... Plan'') or the YUM! Brands International Retirement Plan determined using interest rate and mortality rate assumptions consistent with those used in the Company's financial statements. 2010 Fiscal Year Pension Benefits Table Number of Present Value of Years of Accumulated Credited Service Benefit... -
Page 79
... rate changes from year to year which are used to determine benefits under the plan. (1) YUM! Brands Retirement Plan The Retirement Plan and the Pension Equalization Plan (discussed below) provide an integrated program of retirement benefits for salaried employees who were hired by the Company... -
Page 80
...! Brands International Retirement Plan. All other non-qualified benefits are paid from the YUM! Brands Inc. Pension Equalization Plan. The estimated lump sum values in the table above are calculated assuming no increase in the participant's Final Average Earnings. The lump sums are estimated using... -
Page 81
... or one or more of the group of corporations that is controlled by the Company. 9MAR201101440694 Proxy Statement Benefits are payable under the same terms and conditions as the Retirement Plan without regard to Internal Revenue Service limitations on amounts of includible compensation and maximum... -
Page 82
... that is, they provide market rate returns and do not provide for preferential earnings. The S&P 500 index fund, bond market index fund and stable value fund are designed to track the investment return of like-named funds offered under the Company's 401(k) Plan. The YUM! Stock Fund and YUM! Matching... -
Page 83
...-defer. Investments in the YUM! Stock Fund and YUM! Matching Stock Fund are only distributed in shares Under the LRP, participants receive a distribution of their vested account balance following the later to occur of their attainment of age 55 or retirement from the Company. Executive Contributions... -
Page 84
... which has previously been reported as compensation to the executive in the Company's Summary Compensation Table for 2010 and prior years or would have been reported as compensation if the executive had been a NEO in those previous years. Novak . Carucci Su ...Allan . . Bergren ...38,923,231... -
Page 85
... 31, 2010, given the NEO's compensation and service levels as of such date and, if applicable, based on the Company's closing stock price on that date. These benefits are in addition to benefits available generally to salaried employees, such as distributions under the Company's 401(k) Plan, retiree... -
Page 86
... performance. Pension Benefits. The Pension Benefits Table on page 59 describes the general terms of each pension plan in which the NEOs participate, the years of credited service and the present value of the annuity payable to each NEO assuming termination of employment as of December 31, 2010... -
Page 87
... as of December 31, 2010, the following payments, or other benefits would have been made. Proxy Statement Novak $ Carucci $ Su $ Allan $ Bergren $ 9MAR201101440694 Annual Incentive ...Severance Payment ...Outplacement ...Excise Tax and Gross-Up ...Accelerated Vesting of Stock Options and SARs... -
Page 88
... assumptions used to value the awards, see the discussion of stock awards and option awards contained in Part II, Item 8, ''Financial Statements and Supplementary Data'' of the 2010 Annual Report in Notes to Consolidated Financial Statements at Note 15, ''Share-based and Deferred Compensation Plans... -
Page 89
...an additional $10,000 stock retainer annually. In September 2010, the Management Planning and Development Committee of the Board of Directors completed a review of compensation for non-employee directors, noting that director compensation had not increased since 2006. The review included an analysis... -
Page 90
... 31, 2010, the equity compensation plans under which we may issue shares of stock to our directors, officers and employees under the 1999 Long Term Incentive Plan (''1999 Plan''), the 1997 Long Term Incentive Plan (the ''1997 Plan''), SharePower Plan and Restaurant General Manager Stock Option Plan... -
Page 91
... Area Coaches, Franchise Business Leaders and other supervisory field operation positions that support RGMs and have profit and loss responsibilities within a defined region or area. While all non-executive officer employees are eligible to receive awards under the RGM plan, all awards granted have... -
Page 92
...the Company's internal auditors, in each case without the presence of the Company's management, as well as executive sessions consisting of only Committee members. In addition to the scheduled meetings, senior management confers with the Committee or its Chair from time to time, as senior management... -
Page 93
... recommended to the Board of Directors that it include the audited consolidated financial statements in the Company's Annual Report on Form 10-K for the fiscal year ended December 25, 2010 for filing with the SEC. Who prepared this report? This report has been furnished by the members of the Audit... -
Page 94
...? The Company has adopted a procedure called ''householding'' which has been approved by the SEC. The Company and some brokers household proxy materials, delivering a single Notice and, if applicable, this proxy statement and Annual Report, to multiple shareholders sharing an address unless contrary... -
Page 95
... our proxy statement. These procedures provide that nominations for director nominees and/or an item of business to be introduced at an Annual Meeting of Shareholders must be submitted in writing to our Corporate Secretary at our principal executive offices and you must include information set forth... -
Page 96
...by the board of directors of a public company. In furtherance of the foregoing, but without limitation, the Board of Directors shall have the exclusive power and authority to: (a) elect all executive officers of the Corporation as the Board may deem necessary or desirable from time to time, to serve... -
Page 97
(This page has been left blank intentionally.) -
Page 98
... solely of shares of Common Stock) held by non-affiliates of the registrant as of June 12, 2010 computed by reference to the closing price of the registrant's Common Stock on the New York Stock Exchange Composite Tape on such date was $19,523,128,212. All executive officers and directors of the... -
Page 99
... Risk Factors included in Part I, Item 1A of this Form 10-K and (ii) the factors described in Management's Discussion and Analysis of Financial Condition and Results of Operations included in Part II, Item 7 of this Form 10-K. You should not place undue reliance on forward-looking statements, which... -
Page 100
... to the Company. Throughout this Form 10-K, the terms "restaurants," "stores" and "units" are used interchangeably. This Form 10-K should be read in conjunction with the Forward-Looking Statements on page 2 and the Risk Factors set forth in Item 1A. (a) General Development of Business In January... -
Page 101
...to dine in and/or carry out food. In addition, Taco Bell, KFC, LJS and A&W offer a drive-thru option in many stores. Pizza Hut offers a drive-thru option on a much more limited basis. Pizza Hut and, on a much more limited basis, KFC offer delivery service. Each Concept has proprietary menu items and... -
Page 102
..., the first franchise unit was opened. Today, Pizza Hut is the largest restaurant chain in the world specializing in the sale of ready-to-eat pizza products. As of year end 2010, Pizza Hut was the leader in the U.S. pizza QSR segment, with a 14 percent market share (Source: The NPD Group, Inc.; NPD... -
Page 103
...and customs, covering all aspects of restaurant operations, including food handling and product preparation procedures, safety and quality issues, equipment maintenance, facility standards and accounting control procedures. The restaurant management teams are responsible for the day-to-day operation... -
Page 104
... and Distribution The Company's Concepts, including Concept units operated by its franchisees, are substantial purchasers of a number of food and paper products, equipment and other restaurant supplies. The principal items purchased include chicken, cheese, beef and pork products, seafood, paper and... -
Page 105
... believes that many of these marks, including its Kentucky Fried Chicken®, KFC®, Pizza Hut®, Taco Bell® and Long John Silver's® marks, have significant value and are materially important to its business. The Company's policy is to pursue registration of its important marks whenever feasible... -
Page 106
..., Kentucky (KFC); Dallas, Texas (Pizza Hut and YRI); and Irvine, California (Taco Bell) and in several locations outside the U.S., including Shanghai, China. The Company expensed $33 million, $31 million and $34 million in 2010, 2009 and 2008, respectively, for R&D activities. From time to time... -
Page 107
... Areas Financial information about our significant geographic areas (U.S., International Division and China Division) is incorporated herein by reference from Selected Financial Data in Part II, Item 6, page 23; Management's Discussion and Analysis of Financial Condition and Results of Operations... -
Page 108
...our results of operations, financial condition or cash flows. We may not attain our target development goals and aggressive development could cannibalize existing sales. Our growth strategy depends in large part on our ability to increase our net restaurant count in markets outside the United States... -
Page 109
... the financial or management resources that they need to open or continue operating the restaurants contemplated by their franchise agreements with us. In addition, franchisees may not be able to find suitable sites on which to develop new restaurants or negotiate acceptable lease or purchase terms... -
Page 110
... in the U.S., which could reduce the percentage of Company ownership of KFCs, Pizza Huts, and Taco Bells in the U.S. from approximately 15% at the end of 2010 to approximately 12% by the end of 2011. Our ability to execute this plan will depend on, among other things, whether we receive fair... -
Page 111
... and consumer confidence. These and other macroeconomic factors could have an adverse effect on our sales mix, profitability or development plans, which could harm our financial condition and operating results. The impact of potentially limited credit availability on third party vendors such as our... -
Page 112
...industry in which we operate is highly competitive. The retail food industry in which we operate is highly competitive with respect to price and quality of food products, new product development, price, advertising levels and promotional initiatives, customer service, reputation, restaurant location... -
Page 113
... Consolidated Financial Statements, is not likely to have a material adverse effect on the Company's annual results of operations, financial condition or cash flows. The following is a brief description of the more significant of the categories of lawsuits and other matters we face from time to time... -
Page 114
... on a number of issues, including, but not limited to, compliance with product specifications and terms of procurement and service requirements. Employees At any given time, the Company or its affiliates employ hundreds of thousands of persons, primarily in its restaurants. In addition, each year... -
Page 115
... named Chief Operating Officer, he served as President of U.S. Brand Building, a position he held from December 2006 to June 2008. He served as President and Chief Concept Officer of Taco Bell, a position he held from July 2000 to November 2006. Scott O. Bergren, 64, is Chief Executive Officer Pizza... -
Page 116
... 2000 until January 2008, he was Senior Vice President/Managing Director of YUM Restaurants International South Pacific. Jing-Shyh S. Su, 58, is Vice-Chairman of the Board of YUM and Chairman and Chief Executive Officer of YUM Restaurants China. He has served in this position since May 2010. He has... -
Page 117
... in 2010. The Company is targeting an annual dividend payout ratio of 35% to 40% of net income. As of February 9, 2011, there were approximately 72,000 registered holders of record of the Company's Common Stock. The Company had no sales of unregistered securities during 2010, 2009 or 2008. Form 10... -
Page 118
... ended December 25, 2010, all share repurchases were made pursuant to this authorization. In January 2011, our Board of Directors authorized additional share repurchases through July 2012, of up to $750 million (excluding applicable transaction fees) of our outstanding Common Stock. Form 10-K 21 -
Page 119
... Stock to the cumulative total return of the S&P 500 Stock Index and the S&P 500 Consumer Discretionary Sector, a peer group that includes YUM, for the period from December 30, 2005 to December 23, 2010, the last trading day of our 2010 fiscal year. The graph assumes that the value of the investment... -
Page 120
...loss)(b) Operating Profit(c) Interest expense, net Income before income taxes Net Income - including noncontrolling interest Net Income - YUM! Brands, Inc. Basic earnings per common share(d) Diluted earnings per common share(d) Diluted earnings per common share before special items(e) Cash Flow Data... -
Page 121
... is useful to investors as a significant indicator of the overall strength of our business as it incorporates all our revenue drivers, Company and franchise same store sales as well as net unit development. Same store sales growth includes the results of all restaurants that have been open one year... -
Page 122
... as net unit development. Same store sales is the estimated growth in sales of all restaurants that have been open one year or more. Company restaurant profit is defined as Company sales less expenses incurred directly by our Company restaurants in generating Company sales. Company restaurant margin... -
Page 123
...which we expect to drive Operating Profit growth of 15%. Drive Aggressive International Expansion and Build Strong Brands Everywhere - The Company and its franchisees opened nearly 900 new restaurants in 2010 in the Company's International Division, representing 11 straight years of opening over 700... -
Page 124
Drive Industry-Leading, Long-Term Shareholder and Franchisee Value - The Company is focused on delivering high returns and returning substantial cash flows to its shareholders via dividends and share repurchases. The Company has one of the highest returns on invested capital in the Quick Service ... -
Page 125
... 6% in China and 1% in the U.S. Same store sales were flat in YRI. International development continued at a strong pace with 1,391 new restaurants including 507 new units in China and 884 new units in YRI. Worldwide restaurant margin increased 1.3 percentage points to 17.0% including improvement in... -
Page 126
... Amount 2010 Company sales Franchise and license fees and income Total revenues Company restaurant profit % of Company sales Operating Profit Interest expense, net Income tax provision Net Income - including noncontrolling interest Net Income - noncontrolling interest Net Income - YUM! Brands, Inc... -
Page 127
... in 2010, 2009 and 2008 that the Company does not believe are indicative of our ongoing operations due to their size and/or nature. Year 12/25/10 Detail of Special Items U.S. Refranchising gain (loss) Long John Silver's/A&W U.S. Goodwill impairment charge Charges relating to U.S. G&A productivity... -
Page 128
...U.S. business transformation measures in 2010, 2009 and 2008 included: expansion of our U.S. refranchising; a reduced emphasis on multi-branding as a long-term growth strategy; G&A productivity initiatives and realignment of resources (primarily severance and early retirement costs); and investments... -
Page 129
... had 102 KFCs and 53 Pizza Hut franchise restaurants at the time of the transaction. The write off of goodwill included in this loss was minimal as our Mexico reporting unit includes an insignificant amount of goodwill. This loss did not result in any related income tax benefit and was not allocated... -
Page 130
...positively impacted Operating Profit by $4 million. The impact on Net Income - YUM! Brands, Inc. was not significant to the years ended December 25, 2010 and December 26, 2009. Sale of our Interest in our Unconsolidated Affiliate in Japan During the year ended December 27, 2008 we recorded a pre-tax... -
Page 131
... 949 265 63 2009 613 194 (26 ) 2008 775 266 (5) Number of units refranchised Refranchising proceeds, pre-tax Refranchising (gain) loss, pre-tax $ $ $ $ $ $ The impact on Operating Profit arising from refranchising is the net of (a) the estimated reductions in restaurant profit, which reflects... -
Page 132
...Decreased Company sales Increased Franchise and license fees and income Decrease in Total revenues $ $ $ $ Worldwide (722) $ 41 $ (681) The following table summarizes the impact of refranchising on Operating Profit as described above: 2010 China Division YRI U.S. (44) Decreased Restaurant profit... -
Page 133
... Company received a Revenue Agent Report ("RAR") from the Internal Revenue Service (the "IRS") relating to its examination of our U.S. federal income tax returns for fiscal years 2004 through 2006. The IRS has proposed an adjustment to increase the taxable value of rights to intangibles used outside... -
Page 134
Restaurant Unit Activity Worldwide Balance at end of 2008 New Builds Acquisitions Refranchising Closures Other Balance at end of 2009 New Builds Acquisitions Refranchising Closures Other Balance at end of 2010 % of Total Company 7,568 595 57 (613) (178) 237 7,666 607 110 (949) (163) - ... -
Page 135
... China Division have been restated to reflect a change in our management reporting structure. The International Division ending balances for 2008 and 2009 now include 393 and 444 Company units, respectively and 176 and 158 Franchisee units, respectively, in Thailand and KFC Taiwan with the offset to... -
Page 136
... year. Net unit growth represents the net impact of actual system sales growth due to new unit openings and historical system sales lost due to closures as well as any necessary rounding. 2010 vs. 2009 China Division 6% 11 1 18% 17% YRI -% U.S. 1% 1 N/A 2% N/A Same store sales growth (decline) Net... -
Page 137
... from our brands' participation in the World Expo during 2010. This benefit will not occur in 2011. Form 10-K In 2009, the increase in China Division Company sales and Restaurant profit associated with store portfolio actions was primarily driven by the development of new units and the acquisition... -
Page 138
... year. In 2009, the increase in YRI Company sales and Restaurant profit associated with store portfolio actions was driven by new unit development partially offset by refranchising and closures. Significant other factors impacting Company sales and/or Restaurant profit were Company same store sales... -
Page 139
.... Company same store sales were flat for the year. In 2009, the decrease in U.S. Company sales and Restaurant profit associated with store portfolio actions was primarily driven by refranchising. Significant other factors impacting Company sales and/or Restaurant profit were Company same store sales... -
Page 140
...Franchise and license fees and income for 2009 included a reduction of $32 million as a result of our reimbursements to KFC franchisees for installation costs for the national launch of Kentucky Grilled Chicken that has not been allocated to the U.S. segment for performance reporting purposes. Form... -
Page 141
... 7% in 2010. The decrease was driven by lower provision for U.S. past due receivables (primarily at KFC and Pizza Hut) and lapping 2009 international franchise convention costs. Franchise and license expenses increased 19% in 2009. The increase was driven by quality control initiatives, increased... -
Page 142
... of a former unconsolidated affiliate in China(a) Gain upon sale of investment in unconsolidated affiliate(b) Foreign exchange net (gain) loss and other Other (income) expense (a) (b) $ $ 2010 (42) - - (1) (43) $ $ 2009 (36) (68) - - (104) 2008 $ (41) - (100) (16) $ (157) See Note 4 for... -
Page 143
... driven by the impact of same store sales growth and new unit development, partially offset by higher G&A costs. Operating profit benefited $16 million from our brands' participation in the World Expo during 2010. China Division Operating Profit increased 26% in 2009, including a 2%, or $10 million... -
Page 144
... Company operated KFC restaurants in the U.S. and a non-cash loss of $52 million related to the sale of our Mexico equity business, offset by U.S. gains for restaurants sold at Pizza Hut and Taco Bell. See Note 4 for further discussion. Interest Expense, Net 2010 195 (20) 175 2009 212 (18) 194 2008... -
Page 145
... were only partially offset by related foreign tax credits generated during the year. In 2008, the benefit was positively impacted by the recognition of deferred tax assets for the net operating losses generated by tax planning actions implemented in 2008 (1.7 percentage points). In addition, the... -
Page 146
...no related income tax benefit. Consolidated Cash Flows Net cash provided by operating activities was $1,968 million compared to $1,404 million in 2009. The increase was primarily driven by higher operating profit before special items and decreased pension contributions. In 2009, net cash provided by... -
Page 147
... substantial cash flows from the operations of our company stores and from our substantial franchise operations which require a limited YUM investment. Net cash provided by operating activities has exceeded $1 billion in each of the last nine fiscal years, including nearly $2 billion in 2010. We... -
Page 148
... 19, 2010 our Board of Directors approved cash dividends of $0.25 per share of Common Stock to be distributed on February 4, 2011 to shareholders of record at the close of business on January 14, 2011. The Company is targeting an ongoing annual dividend payout ratio of 35% - 40% of net income... -
Page 149
...our significant contractual obligations and payments as of December 25, 2010 included: Less than 1 Year $ 804 26 550 625 12 $ 2,017 More than 5 Years $ 3,244 222 2,605 9 10 $ 6,090 Long-term debt obligations(a) Capital leases(b) Operating leases(b) Purchase obligations(c) Other(d) Total contractual... -
Page 150
... 2010 measurement date. Based on the current funding status of the Plan and our UK pension plans, we will not be required to make significant contributions in 2011. Investment performance and corporate bond rates have a significant effect on our net funding position as they drive our asset balances... -
Page 151
... affect our results of operations, financial condition and cash flows in future years. A description of what we consider to be our most significant critical accounting policies follows. Impairment or Disposal of Long-Lived Assets We review our long-lived assets of restaurants (primarily PP&E and... -
Page 152
... business units (typically individual countries) and our China Division brands. Fair value is the price a willing buyer would pay for the reporting unit, and is generally estimated using discounted expected future after-tax cash flows from company operations and franchise royalties. Future cash flow... -
Page 153
... 2010, the Company's reporting units with the most significant refranchising activity and recorded goodwill were our Taiwan business unit and our Pizza Hut-U.S. operating segment. Within our Taiwan business unit, 124 restaurants were refranchised (representing 100% of beginning of year company units... -
Page 154
.... Due to the relatively long time frame over which benefits earned to date are expected to be paid, our PBO's are highly sensitive to changes in discount rates. For our U.S. plans, we measured our PBO using a discount rate of 5.90% at December 25, 2010. This discount rate was determined with the... -
Page 155
The losses our U.S. plan assets have experienced, along with a decrease in discount rates over time, have largely contributed to an unrecognized pre-tax net loss of $363 million included in Accumulated other comprehensive income (loss) for the U.S. plans at December 25, 2010. For purposes of ... -
Page 156
... these jurisdictions and our resulting ability to utilize net operating loss and tax credit carryforward benefits can significantly change based on future events, including our determinations as to the feasibility of certain tax planning strategies. Thus, recorded valuation allowances may be subject... -
Page 157
... the translation of our investments in foreign operations, the fair value of our foreign currency denominated financial instruments and our reported foreign currency denominated earnings and cash flows. For the fiscal year ended December 25, 2010, Operating Profit would have decreased approximately... -
Page 158
...Data. INDEX TO FINANCIAL INFORMATION Page Reference Consolidated Financial Statements Report of Independent Registered Public Accounting Firm Consolidated Statements of Income for the fiscal years ended December 25, 2010, December 26, 2009 and December 27, 2008 Consolidated Statements of Cash Flows... -
Page 159
... 26, 2009, and the related consolidated statements of income, cash flows, and shareholders' equity (deficit) and comprehensive income (loss) for each of the fiscal years in the three-year period ended December 25, 2010. We also have audited YUM's internal control over financial reporting as of... -
Page 160
...! Brands, Inc. and Subsidiaries Fiscal years ended December 25, 2010, December 26, 2009 and December 27, 2008 (in millions, except per share data) 2010 2009 Revenues Company sales $ 9,783 $ 9,413 Franchise and license fees and income 1,560 1,423 Total revenues 11,343 10,836 Costs and Expenses, Net... -
Page 161
... 25, 2010, December 26, 2009 and December 27, 2008 (in millions) 2010 Cash Flows - Operating Activities Net Income - including noncontrolling interest Depreciation and amortization Closures and impairment (income) expenses Refranchising (gain) loss Contributions to defined benefit pension plans Gain... -
Page 162
...Total Current Liabilities Long-term debt Other liabilities and deferred credits Total Liabilities Shareholders' Equity Common Stock, no par value, 750 shares authorized; 469 shares issued in 2010 and 2009 Retained earnings Accumulated other comprehensive loss Total Shareholders' Equity - YUM! Brands... -
Page 163
Consolidated Statements of Shareholders' Equity (Deficit) and Comprehensive Income (Loss) YUM! Brands, Inc. and Subsidiaries Fiscal years ended December 25, 2010, December 26, 2009 and December 27, 2008 (in millions) Yum! Brands, Inc. Issued Common Stock Shares Amount 499 $ - Retained Earnings 1,119... -
Page 164
..., Pizza Hut, Taco Bell, Long John Silver's ("LJS") and A&W All-American Food Restaurants ("A&W") (collectively the "Concepts"). YUM is the world's largest quick service restaurant company based on the number of system units, with more than 37,000 units of which approximately 48% are located outside... -
Page 165
..., which was previously accounted for using the equity method. The increases in cash related to the consolidation of these entities' cash balances ($17 million in both instances) are presented as a single line item on our Consolidated Statements of Cash Flows. We report Net income attributable to the... -
Page 166
... Financial Statements and Notes thereto for prior periods to be comparable with the classification for the fiscal year ended December 25, 2010. These reclassifications had no effect on previously reported Net Income - YUM! Brands, Inc. Franchise and License Operations. We execute franchise... -
Page 167
... effective. We include initial fees collected upon the sale of a restaurant to a franchisee in Refranchising (gain) loss. Direct Marketing Costs. We charge direct marketing costs to expense ratably in relation to revenues over the year in which incurred and, in the case of advertising production... -
Page 168
... incorporates rates of returns for historical refranchising market transactions and is commensurate with the risks and uncertainty inherent in the forecasted cash flows. In executing our refranchising initiatives, we most often offer groups of restaurants. When we believe stores or groups of stores... -
Page 169
... between the financial statement carrying amounts of existing assets and liabilities and their respective tax bases as well as operating loss and tax credit carryforwards. Deferred tax assets and liabilities are measured using enacted tax rates expected to apply to taxable income in the years in... -
Page 170
... required payments. Balances of notes receivable and direct financing leases due within one year are included in Accounts and Notes Receivable while amounts due beyond one year are included in Other assets. Amounts included in Other assets totaled $57 million (net of an allowance of $30 million) and... -
Page 171
... pay for a reporting unit, and is generally estimated using discounted expected future after-tax cash flows from Company operations and franchise royalties. The discount rate is our estimate of the required rate of return that a third-party buyer would expect to receive when purchasing a business... -
Page 172
...pay for the reporting unit and includes the value of franchise agreements. As such, the fair value of the reporting unit retained can include expected cash flows from future royalties from those restaurants currently being refranchised, future royalties from existing franchise businesses and company... -
Page 173
... in Retained Earnings in 2008. There were no shares of our Common Stock repurchased during 2009. See Note 16 for additional information. Pension and Post-retirement Medical Benefits. We measure and recognize the overfunded or underfunded status of our pension and post-retirement plans as an asset or... -
Page 174
... ("G&A") productivity initiatives and realignment of resources (primarily severance and early retirement costs); and investments in our U.S. Brands made on behalf of our franchisees such as equipment purchases. In the years ended December 25, 2010 and December 27, 2008, we recorded pre-tax losses of... -
Page 175
...27% of the outstanding common shares of Little Sheep Group Limited ("Little Sheep") and obtain Board of Directors representation. We began reporting our investment in Little Sheep using the equity method of accounting and this investment is included in Investments in unconsolidated affiliates on our... -
Page 176
... 25, 2010 and December 26, 2009, the consolidation of the existing restaurants upon acquisition increased Operating Profit by $3 million and $4 million, respectively. The impact on Net Income - YUM! Brands, Inc. was not significant to either the year ended December 25, 2010 or December 26, 2009. The... -
Page 177
... charges by reportable segment are as follows: 2010 China Division $ (8) $ $ - 16 16 YRI 53 2 12 14 U.S. 18 3 14 17 Worldwide 63 5 42 47 Refranchising (gain) loss(a) (b) (c) Store closure (income) costs(d) Store impairment charges Closure and impairment (income) expenses $ $ $ $ $ $ 2009... -
Page 178
... do not include any allocation of the KFC reporting unit goodwill in the restaurant group carrying value. This additional non-cash write down would be recorded, consistent with our historical policy, if the restaurant groups, or any subset of the restaurant groups, ultimately meet the criteria to be... -
Page 179
... as the fair value of the Taiwan reporting unit exceeded its carrying amount. (d) Store closure (income) costs include the net gain or loss on sales of real estate on which we formerly operated a Company restaurant that was closed, lease reserves established when we cease using a property under an... -
Page 180
... Balance Sheets. Note 5 - Supplemental Cash Flow Data 2010 Cash Paid For: Interest Income taxes Significant Non-Cash Investing and Financing Activities: Capital lease obligations incurred to acquire assets Net investment in direct financing leases Increase (decrease) in accrued capital expenditures... -
Page 181
... Information Prepaid Expenses and Other Current Assets Income tax receivable Other prepaid expenses and current assets 2010 115 154 269 2010 542 3,709 274 2,578 7,103 (3,273) 3,830 2009 158 156 314 2009 538 3,800 282 2,627 7,247 (3,348) 3,899 $ $ $ $ Property, Plant and Equipment Land Buildings... -
Page 182
... Pizza Hut South Korea reporting unit in the fourth quarter of 2009 as the carrying value of this reporting unit exceeded its fair value. The fair value of this reporting unit was based on the discounted expected after-tax cash flows from company operations and franchise royalties for the business... -
Page 183
... States. See Note 4. (d) Intangible assets, net for the years ended 2010 and 2009 are as follows: 2010 Gross Carrying Amount Definite-lived intangible assets Franchise contract rights Trademarks/brands Lease tenancy rights Favorable operating leases Reacquired franchise rights Other $ 163 234 56... -
Page 184
...- Short-term Borrowings and Long-term Debt 2010 Short-term Borrowings Current maturities of long-term debt Other $ $ Long-term Debt Unsecured International Revolving Credit Facility, expires November 2012 Unsecured Revolving Credit Facility, expires November 2012 Senior Unsecured Notes Capital lease... -
Page 185
...Senior Unsecured Notes issued that remain outstanding at December 25, 2010: Interest Rate Issuance Date(a) April 2001 June 2002 April 2006 October 2007 October 2007 September 2009 September 2009 August 2010 (a) (b) Maturity Date April 2011 July 2012 April 2016 March 2018 November 2037 September 2015... -
Page 186
...follows: Year ended: 2011 2012 2013 2014 2015 Thereafter Total $ $ 653 268 5 6 257 2,138 3,327 Interest expense on short-term borrowings and long-term debt was $195 million, $212 million and $253 million in 2010, 2009 and 2008, respectively. Note 11 - Leases At December 25, 2010 we operated more... -
Page 187
... 63 23 23 23 222 $ 380 Operating $ 550 514 483 447 405 2,605 $ 5,004 Lease Receivables Direct Financing $ 12 12 17 16 13 58 $ 128 Operating 49 42 38 37 34 151 $ 351 $ 2011 2012 2013 2014 2015 Thereafter At December 25, 2010 and December 26, 2009, the present value of minimum payments under capital... -
Page 188
... instruments for the years ended December 25, 2010 and December 26, 2009 were: Fair Value Interest Rate Swaps - Asset Interest Rate Swaps - Asset Foreign Currency Forwards - Asset Foreign Currency Forwards - Liability Total 2010 $ 8 2009 $ - Consolidated Balance Sheet Location Prepaid expenses and... -
Page 189
... the years ended December 25, 2010 or December 26, 2009. Fair Value 2010 4 41 14 59 Foreign Currency Forwards, net Interest Rate Swaps, net Other Investments Total Form 10-K Level 2 2 1 2009 $ 3 44 13 60 $ $ $ The fair value of the Company's foreign currency forwards and interest rate swaps... -
Page 190
...fair value of debt using market quotes and calculations based on market rates. Note 14 - Pension, Retiree Medical and Retiree Savings Plans Pension Benefits We sponsor noncontributory defined benefit pension plans covering certain full-time salaried and hourly U.S. employees. The most significant of... -
Page 191
... our fiscal year ends. U.S. Pension Plans 2010 2009 Change in benefit obligation Benefit obligation at beginning of year Service cost Interest cost Participant contributions Plan amendments Curtailment gain Settlement loss Special termination benefits Exchange rate changes Benefits paid Settlement... -
Page 192
... net loss Prior service cost The accumulated benefit obligation for the U.S. and International pension plans was $1,212 million and $1,105 million at December 25, 2010 and December 26, 2009, respectively. Information for pension plans with an accumulated benefit obligation in excess of plan assets... -
Page 193
... cost (1) - - Exchange rate changes End of year $ 363 $ 346 (a) International Pension Plans 2010 2009 $ 48 $ 41 2 5 (2) (2 2) 4 $ 46 $ 48 Prior service costs are amortized on a straight-line basis over the average remaining service period of employees expected to receive benefits. Settlement loss... -
Page 194
... used to determine the net periodic benefit cost for fiscal years: U.S. Pension Plans Discount rate Long-term rate of return on plan assets Rate of compensation increase 2010 6.30% 7.75% 3.75% 2009 6.50% 8.00% 3.75% 2008 6.50% 8.00% 3.75% International Pension Plans 2010 5.50% 6.66% 4.42% 2009... -
Page 195
... Total fair value of plan assets(d) (a) (b) (c) (d) Short-term investments in money market funds Securities held in common trusts Investments held by the Plan are directly held Excludes net payable of $13 million in the U.S. for purchases of assets included in the above that were settled after year... -
Page 196
... International Pension Plans $ 2 2 2 2 2 11 Year ended: 2011 2012 2013 2014 2015 2016 - 2020 Expected benefits are estimated based on the same assumptions used to measure our benefit obligation on the measurement date and include benefits attributable to estimated further employee service. Form... -
Page 197
... 4. The weighted-average assumptions used to determine benefit obligations and net periodic benefit cost for the post-retirement medical plan are identical to those as shown for the U.S. pension plans. Our assumed heath care cost trend rates for the following year as of 2010 and 2009 are 7.7% and... -
Page 198
... requisite service period which includes the vesting period. The Company has a policy of repurchasing shares on the open market to satisfy award exercises and expects to repurchase approximately 8 million shares during 2011 based on estimates of stock option and SAR exercises for that period. Form... -
Page 199
... restaurant-level employees under the RGM Plan, which cliff vest after four years and expire ten years after grant, and grants made to executives under our other stock award plans, which typically have a graded vesting schedule of 25% per year over four years and expire ten years after grant. We use... -
Page 200
... 2 years. The total fair value at grant date of awards vested during 2010, 2009 and 2008 was $47 million, $52 million and $54 million, respectively. RSUs and PSUs As of December 25, 2010, there was $12 million of unrecognized compensation cost related to 1.7 million unvested RSUs and PSUs. Form 10... -
Page 201
Impact on Net Income The components of share-based compensation expense and the related income tax benefits are shown in the following table: 2010 $ 40 5 2 47 13 $ 4 2009 $ 48 7 1 56 17 $ 4 2008 $ 51 8 - 59 18 $ 4 Options and SARs Restricted Stock Units Performance Share Units Total Share-based ... -
Page 202
... plan accounting and Note 12 for additional information about our derivative instruments. 2010 55 (269) (13) (227) 2009 47 (259) (12) (224) Foreign currency translation adjustment Pension and post-retirement losses, net of tax Net unrealized losses on derivative instruments, net of tax Total... -
Page 203
... local taxes, withholding taxes, and shareholder-level taxes, net of foreign tax credits. The favorable impact is primarily attributable to a majority of our income being earned outside of the U.S. where tax rates are generally lower than the U.S. rate. Form 10-K In 2010, the benefit was positively... -
Page 204
... deferred tax assets for the net operating losses generated by tax planning actions implemented in 2008 (1.7 percentage points). In addition, the benefit was also favorably impacted by a decrease in tax expense for certain foreign markets. Adjustments to reserves and prior years. This item includes... -
Page 205
... 2009 222 148 106 59 157 99 59 850 (187) 663 (240) (118) (46) (404) 259 Net operating loss and tax credit carryforwards Employee benefits Share-based compensation Self-insured casualty claims Lease related liabilities Various liabilities Deferred income and other Gross deferred tax assets Deferred... -
Page 206
...operating loss carryforwards of $1.7 billion. These losses are being carried forward in jurisdictions where we are permitted to use tax losses from prior periods to reduce future taxable income and will expire as follows: Year of Expiration 2012-2015 2016-2030 $ 65 $ 142 88 1,590 $ 153 $ 1,732 2011... -
Page 207
... Company received a Revenue Agent Report ("RAR") from the Internal Revenue Service (the "IRS") relating to its examination of our U.S. federal income tax returns for fiscal years 2004 through 2006. The IRS has proposed an adjustment to increase the taxable value of rights to intangibles used outside... -
Page 208
... in developing, operating, franchising and licensing the worldwide KFC, Pizza Hut, Taco Bell, LJS and A&W concepts. KFC, Pizza Hut, Taco Bell, LJS and A&W operate in 110, 95, 21, 4 and 9 countries and territories, respectively. Our five largest international markets based on operating profit in 2010... -
Page 209
... Kentucky Grilled Chicken. See Note 4. Amounts have not been allocated to the U.S., YRI or China Division segments for performance reporting purposes. Includes equity income from investments in unconsolidated affiliates of $42 million, $36 million and $40 million in 2010, 2009 and 2008, respectively... -
Page 210
... to U.S. general and administrative productivity initiatives and realignment of resources. Additionally, 2008 includes $7 million of charges relating to investments in our U.S. Brands. See Note 4. 2009 includes a $26 million charge to write-off goodwill associated with our LJS and A&W businesses in... -
Page 211
... for eligible participating employees subject to certain deductibles and limitations. We have accounted for our retained liabilities for property and casualty losses, healthcare and long-term disability claims, including reported and incurred but not reported claims, based on information provided by... -
Page 212
... in estimated losses which could be material to our growth in quarterly and annual Net income. We believe that we have recorded reserves for property and casualty losses at a level which has substantially mitigated the potential negative impact of adverse developments and/or volatility. Form 10... -
Page 213
... normal course of business. We provide reserves for such claims and contingencies when payment is probable and reasonably estimable. On November 26, 2001, Kevin Johnson, a former Long John Silver's ("LJS") restaurant manager, filed a collective action against LJS in the United States District Court... -
Page 214
...16, 2008, a putative class action lawsuit against Taco Bell Corp. and the Company, styled Miriam Leyva vs. Taco Bell Corp., et al., was filed in Los Angeles Superior Court. The case was filed on behalf of Leyva and purportedly all other California hourly employees and alleges failure to pay overtime... -
Page 215
...Bell and the Company styled Endang Widjaja vs. Taco Bell Corp., et al. The case was filed on behalf of Widjaja, a former California hourly assistant manager, and purportedly all other individuals employed in Taco Bell's California restaurants as managers and alleges failure to reimburse for business... -
Page 216
... violations, overtime violations, wage statement violations and waiting time penalties. KFC removed the case to the United States District Court for the Central District of California on January 7, 2009. On July 7, 2009, the Judge ruled that the case would not go forward as a class action. Plaintiff... -
Page 217
... in this lawsuit. Taco Bell has taken steps to address potential architectural and structural compliance issues at the restaurants in accordance with applicable state and federal disability access laws. The costs associated with addressing these issues have not significantly impacted our results... -
Page 218
... and business as a result of publications and/or statements it claims were made by Taco Bell in connection with Taco Bell's reporting of results of certain tests conducted during investigations on green onions used at Taco Bell restaurants. The parties participated in mediation on April 10, 2008... -
Page 219
... Financial Data (Unaudited) 2010 Third Quarter $ 2,496 366 2,862 479 544 357 0.76 0.74 - First Quarter Revenues: Company sales Franchise and license fees and income Total revenues Restaurant profit Operating Profit(a) Net Income - YUM! Brands, Inc. Basic earnings per common share Diluted earnings... -
Page 220
... quarter, we decided to place our Long John Silver's and A&W All-American Food Restaurants brands for sale and began the process to identify a buyer. In the first quarter of 2011, we anticipate that we will recognize a non-cash pre-tax impairment loss in Special Items as a result of our decision to... -
Page 221
... statements. We maintain a system of internal control over financial reporting, designed to provide reasonable assurance as to the reliability of the financial statements, as well as to safeguard assets from unauthorized use or disposition. The system is supported by formal policies and procedures... -
Page 222
...- Integrated Framework, our management concluded that our internal control over financial reporting was effective as of December 25, 2010. KPMG LLP, an independent registered public accounting firm, has audited the consolidated financial statements included in this Annual Report on Form 10-K and the... -
Page 223
... proxy statement which will be filed with the Securities and Exchange Commission no later than 120 days after December 25, 2010. Information regarding executive officers of the Company is included in Part I. Item 11. Executive Compensation. Information regarding executive and director compensation... -
Page 224
...IV Item 15. (a) (1) Exhibits and Financial Statement Schedules. Financial Statements: Consolidated financial statements filed as part of this report are listed under Part II, Item 8 of this Form 10-K. Financial Statement Schedules: No schedules are required because either the required information is... -
Page 225
... annual report has been signed below by the following persons on behalf of the registrant and in the capacities and on the dates indicated. Signature Title Date /s/ David C. Novak David C. Novak Chairman of the Board, Chief Executive Officer and President (principal executive officer) February... -
Page 226
... Jing-Shyh S. Su Jing-Shyh S. Su /s/ Robert D. Walter Robert D. Walter Director February 14, 2011 Director February 14, 2011 Director February 14, 2011 Director February 14, 2011 Director February 14, 2011 Vice-Chairman of the Board February 14, 2011 Director February 14, 2011 Form 10... -
Page 227
YUM! Brands, Inc. Exhibit Index (Item 15) Exhibit Number 3.1 Description of Exhibits Restated Articles of Incorporation of YUM, which is incorporated herein by reference from Exhibit 3.1 to YUM's Annual Report on Form 10-K for the fiscal year ended December 27, 2008. Amended and restated Bylaws of ... -
Page 228
... ended June 13, 2009. YUM 1997 Long Term Incentive Plan, as effective October 7, 1997, which is incorporated herein by reference from Exhibit 10.8 to YUM's Annual Report on Form 10-K for the fiscal year ended December 27, 1997. YUM Executive Incentive Compensation Plan, as effective May 20, 2004... -
Page 229
...13, 2004, by and between the Company and Samuel Su, which is incorporated herein by reference from Exhibit 10.28 to YUM's Annual Report on Form 10-K for the fiscal year ended December 25, 2004. Form of 1999 Long Term Incentive Plan Award Agreement (Stock Appreciation Rights) which is incorporated by... -
Page 230
..., 2009. 2010 YUM! Brands Supplemental Long Term Disability Coverage Summary, as effective January 1, 2010, which is incorporated by reference from Exhibit 10.26 to YUM's Annual Report on Form 10-K for the fiscal year ended December 26, 2009. 1999 Long Term Incentive Plan Award (Restricted Stock Unit... -
Page 231
...which are omitted in the copy of the exhibit electronically filed with the SEC. The omitted information has been filed separately with the SEC pursuant to our application for confidential treatment. Indicates a management contract or compensatory plan. 32.1 32.2 101.INS* 101.SCH* 101.CAL* 101.LAB... -
Page 232
...the name of a bank or broker) should direct communications about all administrative matters related to their accounts to their stockbroker. LONG TERM INCENTIVE PLAN (LTIP) AND YUMBUCKS PARTICIPANTS (employees with rights to LTIP and YUMBUCKS options and stock appreciation rights) should address all... -
Page 233
... the NYSE, the world's leading equities market. Franchise Inquiries DOMESTIC FRANCHISING INQUIRY PHONE LINE (866) 2YUMYUM (298-6986) INTERNATIONAL FRANCHISING INQUIRY PHONE LINE (972) 338-7780 ONLINE FRANCHISE INFORMATION http://www.yumfranchises.com/ Yum! Brands' Annual Report contains many of the... -
Page 234
Yum! brands, Inc. 2010 annual customer manIa report -
Page 235
... Senior Vice President, General Counsel, Secretary and Chief Franchise Policy Officer, Yum! Brands, Inc. Richard T. Carucci 53 Chief Financial Officer, Yum! Brands, Inc. Greg Creed 53 Chief Executive Officer, Taco Bell Roger Eaton 50 Chief Executive Officer, KFC U.S. and Yum! Operational Excellence... -
Page 236
Alone we're delicious. Together we're Yum! ® www.yum.com/annualreport Yum! Brands, Inc., trades under the symbol YUM and is proud to meet the listing requirements of the NYSE, the world's leading equities market.