Taco Bell 2003 Annual Report Download
Download and view the complete annual report
Please find the complete 2003 Taco Bell annual report below. You can navigate through the pages in the report by either clicking on the pages listed below, or by using the keyword search tool below to find specific information within the annual report.-
 1
1 -
 2
2 -
 3
3 -
 4
4 -
 5
5 -
 6
6 -
 7
7 -
 8
8 -
 9
9 -
 10
10 -
 11
11 -
 12
12 -
13
-
14
-
15
-
16
-
17
-
18
-
19
-
20
-
21
-
22
-
23
-
24
-
25
-
26
-
27
-
28
-
29
-
30
-
31
-
32
-
33
-
34
-
35
-
36
-
37
-
38
-
39
-
40
-
41
-
42
-
43
-
44
-
45
-
46
-
47
-
48
-
49
-
50
-
51
-
52
-
53
-
54
-
55
-
56
-
57
-
58
-
59
-
60
-
61
-
62
-
63
-
64
-
65
-
66
-
67
-
68
-
69
-
70
-
71
-
72
-
73
-
74
-
75
-
76
-
77
-
78
-
79
-
80
-
81
-
82
-
83
-
84
 |
 |
YUM! BRANDS 2003 ANNUAL CUSTOMER MANIA REPORT
Power
Yum!
of
Table of contents
-
Page 1
YUM! BRANDS 2003 ANNUAL CUSTOMER MANIA REPORT Power of Yum! -
Page 2
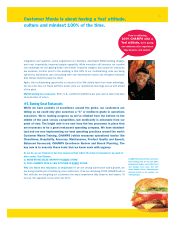
... Hut Gather 'Round the Good Stuff KFC What's Cookin' Long John Silver's/A&W Power of Choice Customer Mania Power 100% CHAMPS with a Yes! Running Great Restaurants 29 30 31 32 Yum! At-a-glance Global Facts Unit Information Power of Results: Yum! Financial Highlights 33 Financials Inbc Power of Giving... -
Page 3
...growth by opening more than 70% of our new international restaurants. Importantly, our franchisees are using their capital, not ours, to grow their business since we strategically elected not to invest in our franchisees' real estate, like some other franchisors do. We love the high return franchise... -
Page 4
... units outside the U.S. and 20% return on invested capital. In the U.S., Taco Bell is now the second most profitable QSR brand and just celebrated hitting the $1 million mark for average unit volumes. In 2003, company same-store sales were up 2% on top of 7% growth the previous year. Top: Pizza Hut... -
Page 5
... service as we roll out the same drive-thru program that worked so effectively for Taco Bell. One big advantage we have is the ability to spread our best practices. Key measures in the U.S.: At least 7% operating profit growth per year and at least 1-2% same-store sales growth. Multibranding gives... -
Page 6
... its signature Root Beer Float. Based on outstanding customer feedback and results, we acquired Long John Silver's and A&W in 2002. With this acquisition we tripled our multibranding potential in the U.S. We can now open high return new restaurants in trade areas that used to be too expensive or did... -
Page 7
... portfolio power, plus our operational learnings put us well ahead of the pack. Multibranding key measures: 500+ U.S. multibrand additions per year and at least mid-teen internal rates of return. #3. Running Great Restaurants While we have pockets of excellence around the globe, our customers are... -
Page 8
... numbers, but I hope you can get a sense of in this report, is the power of the worldwide culture we are building. It's a high energy, people capability first, customer mania culture that is centered on spirited recognition that drives performance. If you talk to our people, you'd hear a universal... -
Page 9
7. -
Page 10
"power global -
Page 11
house" -
Page 12
... our international business continues to set new records in terms of revenues, operating profits and new unit development. In 2003, we achieved $2.7 billion in revenues, operating profits of $441 million and return on invested capital of 20%. What's more, Yum! Restaurants International is a growth... -
Page 13
.... In fact, a J.D. Powers survey two years ago rated KFC as the leading brand in any category - among every company doing business in China! And we're proud Pizza Hut also has become the leader in the casual dining category. We also opened our first Taco Bell Grande restaurant in 2003, introducing... -
Page 14
"brand -
Page 15
power" x5 -
Page 16
14. "Think Outside the Bun." -
Page 17
15. ® 2003 was another solid year for Taco Bell - filled with terrific products and results. Our Customer Mania culture helped drive company same-store sales growth of 2% - and for the first time - our system average unit volume exceeded $1,000,000. CHAMPS performance - tells us that we're on ... -
Page 18
...a brand new and exciting marketing campaign that invites our customers to "Gather 'Round the Good Stuffâ„¢." Our new advertising, products and promotions reinforce that we're the family pizza company for nearly 50 million Pizza Hut customers each week. In 2003, we introduced family-friendly products... -
Page 19
17. -
Page 20
18. KFC What's Cookin' -
Page 21
...-fried products, outstanding value meals, better-run restaurants, new menu boards and improved product packaging. And we're not going to stop there...You'll see a whole new advertising campaign that will remind our customers that our fried chicken is kitchen-fresh. And one of America's hottest race... -
Page 22
20. "Surfs up...Time for a Frosty Float." -
Page 23
... company same-store sales growth 3% in 2003 and will be the key multibrand partner for the other Yum! brands going forward. In fact, Long John Silver's will be the multibrand partner in about one half of the 500 multibrand additions which we expect will open in 2004. This "Fish First" strategy gives... -
Page 24
22. "po pow -
Page 25
...existing restaurant, operators get increased sales from the new concepts while strengthening the base business too. That's why our multibrand company stores are generating between $1.2 to $1.3 million in average unit volumes. In 2003, multibranding was responsible for $185 million in profit and fees... -
Page 26
"pow w customer mania -
Page 27
w wer" -
Page 28
26. Accuracy Speed Hospitality Product Quality Cleanliness Maintenance We think we have the most talented Customer Maniacs in the industry. Meet some of them! Top, left to right: Van Hang, Ramona Macias Middle: Roxie Padot, Jeff Stricklin, Brenda Lederer Bottom: Mitch McCulloch -
Page 29
... on their customers' faces! Mitch McCulloch, Restaurant General Manager, Pizza Hut, High Plains Pizza franchisee "Yum!" RGM Jeff Stricklin's customers say that again and again. It must be why Jeff's same-store sales were up an incredible 20% in 2003. He and his Taco Bell team recorded 16 perfect... -
Page 30
...Sales Growth in Every Store At Yum! Brands we're building an operating culture of 840,000 Customer Maniacs with one purpose: satisfying our customers better than any other restaurant company. The true power of Running Great Restaurants is in giving a trusted customer experience - each and every time... -
Page 31
29. Yum! At-a-glance U.S. Sales by Daypart U.S. Sales by Distribution Channel •Dinner 59% •Lunch 34% •Snacks/Breakfast 7% •Dine Out 80% •Dine In 20% •Dinner 64% •Lunch 27% •Snacks/Breakfast 9% •Dine Out 72% •Dine In 28% ® •Dinner 43% •Lunch 45% •Snacks/Breakfast 12%... -
Page 32
30. Global Facts Worldwide Sales (in billions) 2003 United States KFC Pizza Hut Taco Bell Long John Silver's(c) A&W(c) Total U.S. International KFC Pizza Hut Taco Bell Long John Silver's(c) A&W(c) Total International Worldwide Company sales Franchisee sales(b) $ 7.4 18.5 $ 6.9 17.3 $ 6.1 16.2 $ 6.3... -
Page 33
... Compounded annual growth rate; total U.S., International and Worldwide exclude the impact of Long John Silver's and A&W. (b) Compounded annual growth rate excludes the impact of transferring 30 units from Taco Bell U.S. to Taco Bell International in 2002. (c) Includes 6 and 4 Yan Can units in 2003... -
Page 34
...: We're driving restaurant margins and same-store sales growth. In addition, we continue to focus on new franchise development without having to invest any of our own capital. We receive nearly $1 billion a year in franchise fees. We also continue to focus on our high-return international expansion... -
Page 35
... Pizza Hut, Taco Bell, Long John Silver's ("LJS") and A&W All-American Food Restaurants ("A&W") (collectively "the Concepts") and is the world's largest quick service restaurant ("QSR") company based on the number of system units. LJS and A&W were added when YUM acquired Yorkshire Global Restaurants... -
Page 36
... of units closed Store closure costs Impairment charges for stores to be closed 2003 287 $ 6 $ 12 2002 224 $ 15 $ 9 2001 270 $ 17 $ 5 U.S. International Worldwide Decreased restaurant profit Increased franchise fees Decreased general and administrative expenses (Decrease) increase in operating... -
Page 37
...975 2,345 WORLDWIDE RESULTS OF OPERATIONS % B/(W) vs. % B/(W) vs. 2003 2002 Revenues Company sales Franchise and license fees Total revenues Company restaurant margin % of Company sales Operating profit Interest expense, net Income tax provision Income before cumulative effect of accounting change... -
Page 38
... Taco Bell franchisees in 2001. The decrease was partially offset by higher marketing support costs in certain international markets. WORLDWIDE COMPANY RESTAURANT MARGIN Company sales Food and paper Payroll and employee benefits Occupancy and other operating expenses Company restaurant margin 2003... -
Page 39
...) expense in 2003 was primarily driven by the improved operating performance of our unconsolidated affiliates, particularly in China. WORLDWIDE INCOME TAXES 2003 Reported Income taxes Effective tax rate $ 268 30.2% 2002 $ 275 32.1% 2001 $ 241 32.8% WORLDWIDE FACILITY ACTIONS We recorded a net loss... -
Page 40
...basis to insure that they have been appropriately adjusted for events that we believe may impact our exposure. U.S. RESULTS OF OPERATIONS % B/(W) vs. % B/(W) vs. 2003 2002 Revenues Company sales Franchise and license fees Total revenues Company restaurant margin % of Company sales Operating profit... -
Page 41
...blended same store sales include KFC, Pizza Hut, and Taco Bell company owned restaurants only. U.S. same store sales for Long John Silver's and A&W restaurants are not included. Following are the same store sales growth results by brand: 2003 Same Store Sales Transactions Average Guest Check due to... -
Page 42
... increase was driven by new unit development and same store sales growth, partially offset by store closures. INTERNATIONAL COMPANY RESTAURANT MARGIN Company sales Food and paper Payroll and employee benefits Occupancy and other operating expenses Company restaurant margin 2003 100.0% 35.5 19.0 30... -
Page 43
... impact of lower restaurant operating costs and the elimination of lower average margin units through store closures. Lower restaurant operating costs primarily resulted from lower food and paper costs, partially offset by higher labor costs. In 2002, net cash used in investing activities was $885... -
Page 44
... to the Company's historical refranchising programs and, to a lesser extent, franchisee development of new restaurants. The total loans outstanding under these loan pools were approximately $123 million at December 27, 2003. In support of these guarantees, we have posted $32 million of letters of... -
Page 45
...reflects only current compensation levels. Due to the relatively long time frame over which benefits earned to date are expected to be paid, our PBO and ABO are highly sensitive to changes in discount rates. We measured our PBO and ABO using a discount rate of 6.25% at September 30, 2003. A 50 basis... -
Page 46
... sales growth and margin improvement to those that are supportable based upon our plans for the unit and actual results at comparable restaurants. If the long-lived assets of a restaurant on a held and used basis are not recoverable based upon forecasted, undiscounted cash flows, we write the assets... -
Page 47
... such as sales growth and margin improvement to those that are supportable based upon our plans for the reporting unit. For 2003, there was no impairment of goodwill identified during our annual impairment testing. For our reporting units with goodwill, the fair value is generally significantly... -
Page 48
...$6 million, respectively, in annual income before income taxes. The estimated reductions are based upon the level of variable rate debt and assume no changes in the volume or composition of debt. In addition, the fair value of our derivative financial instruments at December 27, 2003 and December 28... -
Page 49
... liabilities) totaled approximately $1.3 billion as of December 27, 2003. Operating in international markets exposes the Company to movements in foreign currency exchange rates. The Company's primary exposures result from our operations in Asia-Pacific, the Americas and Europe. Changes in foreign... -
Page 50
...millions, except per share data) 2003 2002 2001 Revenues Company sales Franchise and license fees $ 7,441 939 8,380 $ 6,891 866 7,757 $ 6,138 815 6,953 Costs and Expenses, net Company restaurants Food and paper Payroll and employee benefits Occupancy and other operating expenses 2,300 2,024... -
Page 51
... effects of acquisitions and dispositions: Accounts and notes receivable Inventories Prepaid expenses and other current assets Accounts payable and other current liabilities Income taxes payable Net change in operating working capital Net Cash Provided by Operating Activities Cash Flows - Investing... -
Page 52
... Cash and cash equivalents Short-term investments, at cost Accounts and notes receivable, less allowance: $28 in 2003 and $42 in 2002 Inventories Assets classified as held for sale Prepaid expenses and other current assets Deferred income taxes Total Current Assets Property, plant and equipment... -
Page 53
...' Equity (Deficit) and Comprehensive Income Fiscal years ended December 27, 2003, December 28, 2002 and December 29, 2001 Yum! Brands Inc. 51. (in millions) Issued Common Stock Shares Amount Retained Earnings (Accumulated Deficit) Accumulated Other Comprehensive Income (Loss) Total Balance... -
Page 54
... Hut, Taco Bell and since May 7, 2002, Long John Silver's ("LJS") and A&W All-American Food Restaurants ("A&W") (collectively the "Concepts"), which were added when we acquired Yorkshire Global Restaurants, Inc. ("YGR"). YUM is the world's largest quick service restaurant company based on the number... -
Page 55
... restaurants using a "two-year history of operating losses" as our primary indicator of potential impairment. Based on the best information available, we write down an impaired restaurant to its estimated fair market value, which becomes its new cost basis. We generally measure estimated fair market... -
Page 56
... experienced two consecutive years of operating losses. Our impairment measurement test for an investment in an unconsolidated affiliate is similar to that for our restaurants except that we use discounted cash flows after interest and taxes instead of discounted cash flows before interest and taxes... -
Page 57
...and our business management units internationally (typically individual countries). Goodwill impairment tests consist of a comparison of each reporting unit's fair value with its carrying value. The fair value of a reporting unit is the amount for which the unit as a whole could be sold in a current... -
Page 58
...the effect on net income and earnings per share if the Company had applied the fair value recognition provisions of SFAS No. 123 "Accounting for Stock-Based Compensation," to stock-based employee compensation. 2003 Net Income, as reported $ 617 Deduct: Total stock-based employee compensation expense... -
Page 59
... fair values of YGR's assets acquired and liabilities assumed at the date of acquisition. Current assets Property, plant and equipment Intangible assets Goodwill Other assets Total assets acquired Current liabilities Long-term debt, including current portion Future rent obligations related to sale... -
Page 60
... Company sales Franchise and license fees 2002 $ 7,139 877 2001 $ 6,683 839 The impact of the acquisition, including interest expense on debt incurred to finance the acquisition, on net income and diluted earnings per share would not have been significant in 2002 and 2001. The pro forma information... -
Page 61
... for reporting as discontinued operations were not material. Restaurant profit represents Company sales less the cost of food and paper, payroll and employee benefits and occupancy and other operating expenses. 2003 Stores held for sale at December 27, 2003: Sales Restaurant profit Stores disposed... -
Page 62
... market value of assets received in connection with a non-cash acquisition - Debt reduction due to amendment of sale-lease back agreements (See Note 14) 88 Equity income from investments in unconsolidated affiliates Foreign exchange net (gain) loss note 11 PROPERTY, PLANT AND EQUIPMENT, NET 2003... -
Page 63
... most significant recorded trademark/brand assets resulted when we acquired YGR in 2002. The fair value of a trademark/brand is determined based upon the value derived from the royalty we avoid, in the case of Company stores, or receive, in the case of franchise and licensee stores, for the use of... -
Page 64
... issuance costs of approximately $5 million related to the 2012 Notes in the third quarter of 2002. The following table summarizes all Senior Unsecured Notes issued under this shelf registration through December 27, 2003: Issuance Date Maturity Date Principal Amount Interest Rate Stated Effective... -
Page 65
... for our restaurants. Capital and operating lease commitments expire at various dates through 2087 and, in many cases, provide for rent escalations and renewal options. Most leases require us to pay related executory costs, which include property taxes, maintenance and insurance. Future minimum... -
Page 66
... guarantees and letters of credit using market quotes and calculations based on market rates. note 17 PENSION AND POSTRETIREMENT MEDICAL BENEFITS Pension Benefits We sponsor noncontributory defined benefit pension plans covering substantially all full-time U.S. salaried employees, certain hourly... -
Page 67
...2003 2002 Change in benefit obligation Benefit obligation at beginning of year Service cost Interest cost Plan amendments Curtailment gain Benefits and expenses paid Actuarial loss Benefit obligation at end of year Change in plan assets Fair value of plan assets at beginning of year Actual return... -
Page 68
... returns for each asset category, adjusted for an assessment of current market conditions. Assumed health care cost trend rates at September 30: Postretirement Medical Benefits categories of equity and debt security performance. The investment strategy is primarily driven by lower participant ages... -
Page 69
...fifteen years after grant. We estimated the fair value of each option grant made during 2003, 2002 and 2001 as of the date of grant using the Black-Scholes option-pricing model with the following weighted average assumptions: Risk-free interest rate Expected life (years) Expected volatility Expected... -
Page 70
.... These investment options are limited to cash and phantom shares of our Common Stock. The EID Plan allows participants to defer incentive compensation to purchase phantom shares of our Common Stock at a 25% discount from the average market price at the date of deferral (the "Discount Stock Account... -
Page 71
... transaction fees). During 2003, we repurchased approximately 169,000 shares for approximately $5.7 million under this program at an average price per share of approximately $34. Based on market conditions and other factors, additional repurchases may be made from time to time in the open market or... -
Page 72
... added when we acquired YGR. KFC, Pizza Hut, Taco Bell, LJS and A&W operate throughout the U.S. and in 88, 86, 12, 3 and 13 countries and territories outside the U.S., respectively. Our five largest international markets based on operating profit in 2003 are China, United Kingdom, Australia, Canada... -
Page 73
... (charges) credits(c) 26 Total operating profit 1,059 Interest expense, net (173) Income before income taxes and cumulative effect of accounting change $ 886 Depreciation and Amortization United States International Corporate 2003 240 146 15 $ 401 $ 2003 395 246 22 $ 663 $ 2003 $ 3,279 1,880 461... -
Page 74
... loss related to our guarantees of these financial arrangements of unconsolidated affiliates and other third parties. Accordingly, our recorded liability as of December 27, 2003 and December 28, 2002 is not significant. Insurance Programs We are self-insured for a substantial portion of our current... -
Page 75
... District of Michigan. The lawsuit alleged that Taco Bell Corp. misappropriated certain ideas and concepts used in its advertising featuring a Chihuahua. The plaintiffs sought to recover monetary damages under several theories, including breach of implied-in-fact contract, idea misappropriation... -
Page 76
... FINANCIAL DATA (UNAUDITED) First Quarter Second Quarter Third Quarter Fourth Quarter Total 2003 Revenues: Company sales Franchise and license fees Total revenues Wrench litigation AmeriServe and other charges (credits) Total costs and expenses, net Operating profit Income before cumulative effect... -
Page 77
... information presented in the annual report is derived from the financial statements. We maintain a system of internal control over financial reporting, designed to provide reasonable assurance as to the reliability of the financial statements, as well as to safeguard assets from unauthorized use... -
Page 78
... consolidated statements of income, cash flows and shareholders' equity (deficit) and comprehensive income for each of the years in the three-year period ended December 27, 2003. These consolidated financial statements are the responsibility of YUM's management. Our responsibility is to express an... -
Page 79
... Financial Data Fiscal Year (in millions, except per share and unit amounts) 2003 2002 2001 2000 1999 Summary of Operations Revenues Company sales(a) Franchise and license fees Total Facility actions(b) Wrench litigation(c) AmeriServe and other (charges) credits(d) Operating profit Interest... -
Page 80
... Ofï¬cer, Yum! Brands, Inc. Christian L. Campbell 53 Senior Vice President, General Counsel, Secretary and Chief Franchise Policy Ofï¬cer, Yum! Brands, Inc. Steven A. Davis 45 President and Chief Executive Ofï¬cer, Long John Silver's, Inc. and Chief Executive Ofï¬cer, A&W Restaurants, Inc. Gregg... -
Page 81
... Direct Stock Purchase Program ...(888) 439-4986 YUM 401(k) Plan ...(888) 875-4015 YUM Savings Center ...(617) 847-1013 (outside U.S.) P.O. Box 1389 Boston, MA 02104-1389 Please have a copy of your most recent statement available when calling. Press *0 for a customer service representative and give... -
Page 82
....com/franchising/info.htm Yum! Brands' Annual Report contains many of the valuable trademarks owned and used by Yum! Brands and subsidiaries and affiliates in the United States and worldwide. Printed on recycled paper. Financial and Other Information Earnings and other financial results, corporate... -
Page 83
... millions of people who work "after hours" or on weekends. Since 2000, more than $3 million has been awarded to YMCA Child Care Centers nationwide. Taco Bell's TEENSupreme Through a unique partnership with the Boys & Girls Clubs of America, Taco Bell has established a mentoring program for at-risk... -
Page 84
Yum! Yum! Yum! Yum! Yum! Yum! Yum! Yum! Yum! Yum! Yum! Yum! Yum! Yum! Yum! Yum! Yum! Yum! Yum! Yum! Yum! Yum! Yum! Yum! Yum! Yum! Yum! Yum! Yum! Yum! Yum! Yum! Yum! Yum! Yum! Yum! Yum! Yum! Yum! YUM! BRANDS 2003 ANNUAL CUSTOMER MANIA REPORT Alone we're delicious. Together we're