Taco Bell 1999 Annual Report Download
Download and view the complete annual report
Please find the complete 1999 Taco Bell annual report below. You can navigate through the pages in the report by either clicking on the pages listed below, or by using the keyword search tool below to find specific information within the annual report.-
 1
1 -
 2
2 -
 3
3 -
 4
4 -
 5
5 -
 6
6 -
 7
7 -
 8
8 -
 9
9 -
 10
10 -
 11
11 -
 12
12 -
13
-
14
-
15
-
16
-
17
-
18
-
19
-
20
-
21
-
22
-
23
-
24
-
25
-
26
-
27
-
28
-
29
-
30
-
31
-
32
-
33
-
34
-
35
-
36
-
37
-
38
-
39
-
40
-
41
-
42
-
43
-
44
-
45
-
46
-
47
-
48
-
49
-
50
-
51
-
52
-
53
-
54
-
55
-
56
-
57
-
58
-
59
-
60
-
61
-
62
-
63
-
64
-
65
-
66
-
67
-
68
-
69
-
70
-
71
-
72
 |
 |

1999 annual report
Table of contents
-
Page 1
1999 annual report -
Page 2
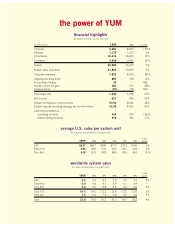
... unit $ in thousands (Compounded annual growth rates) 5-year growth 1999 KFC Pizza Hut Taco Bell $837 696 918 1998 1997 1996 1995 1994 $817 645 931 $786 630 902 $775 620 886 $733 651 925 $706 634 953 3% 2% (1)% worldwide system sales $ in billions (Compounded annual growth rates) 5-year... -
Page 3
..., demonstrating our Passion the way we start all of our major system meetings - with a "YUM Cheer!" Give me a "Y"! Give me a "U"! Give me a "M"! David Alston KFC Restaurant General Manager Jackie Lopez Pizza Hut Restaurant General Manager Carlos Diaz Taco Bell Franchise Restaurant General Manager 1 -
Page 4
...ve worked hard at increasing our performance by developing our culture, driving same store sales growth, improving our restaurant economics and cost structure, while expanding our system. Some key highlights include: 41% ongoing operating EPS growth 4% combined same store sales growth in the United... -
Page 5
... Chalupas at Taco Bell These new products add to our leading category market share. As a result, we are going forward with a signiï¬cant opportunity for future growth off an even stronger competitive foundation. In 1999, Pizza Hut had another outstanding year, with same store sales up 9%. On Super... -
Page 6
... roof, providing customers an opportunity to please the entire family at one counter. We've proven the success of "2-n-1's" - KFC/Taco Bell Express...Taco Bell/Pizza Hut Express...and KFC/Pizza Hut Express. We're going to accelerate building these restaurants, increasing growth opportunities for our... -
Page 7
...moving forward. In fact, on our front cover, we've featured three of our Restaurant General Managers - our #1 leaders - who represent a system built around restaurant teams committed to serving customers better than anyone. David Alston (KFC), Jackie Lopez (Pizza Hut) and Carlos Diaz (Taco Bell) are... -
Page 8
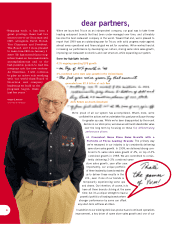
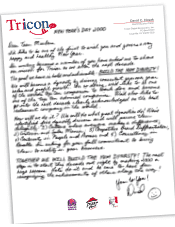
cer Chief Executive Ofï¬ urants, Inc. Tricon Global Resta PO Box 32220 2-2220 Louisville, KY 4023 David C. Novak -
Page 9
our formula for success is working 1 people capability ï¬rst 2 satisï¬ed customers follow 3 then we make more money -
Page 10
... teams, own your customers and own your results," and given our success with driving margins and increasing customer satisfaction, it's a message that's paying off. Second, we're making recognition a key part of our operation. Recognition shows you care and, in this demanding quick-service business... -
Page 11
... best at driving their business with a passion toward putting YUMs on customers' faces around the world. (from back to front) Jackie Lopez, Pizza Hut RGM, Big Cheese Award; Goh Kim Yian, KFC Market Manager, Globe Award; Carlos Delgado, KFC RGM, Bulldog Award; Henry Yip, Pizza Hut Franchise General... -
Page 12
... dynamite sales - as well as improved operations. And though C.H.A.M.P.S. started out at our international business, TRI, we've since spread it across the entire system - ï¬rst to KFC then to Taco Bell, and we recently rolled it out to Pizza Hut last year. And what's more, our restaurant teams love... -
Page 13
...walking the talk of community service by creating and sponsoring programs that support our customers across the globe. Pizza Hut's BOOK IT!® National Reading Incentive Program encourages 20 million kids every year to learn the joy of reading. Taco Bell's TEENSupreme Program, in partnership with the... -
Page 14
...feel and customers in both company and franchise markets love them. In fact, 1999 sales from these assets were extremely promising. Truly, 1999 was another great year for Pizza Hut. And with strategies in place to continue to drive sales, develop new units, build out our delivery segment and satisfy... -
Page 15
Pizza QSR Sales 21% 12% 7% 6% 7% 47% Pizza Hut Domino's Little Caesar's Papa John's Regionals Independents* *Highly fragmented Mike Rawlings President & Chief Concept Ofï¬cer Mike Miles Chief Operating Ofï¬cer 13 -
Page 16
14 -
Page 17
... in speed of service - jumping from seventh in just one year. For ï¬ve years, KFC had same store sales increases. But 1999's 2% same store sales increase was somewhat disappointing. However, we're conï¬dent that the products and programs put in place in 1999 should have positive long-range effects... -
Page 18
... "The Year of the Food!" We'll build sales and transactions by introducing several greattasting new products and differentiating Taco Bell as the best QSR value, bar none. We'll also drive our customerfocused culture even deeper into our restaurants. And you'll ï¬nd us in many new locations - not... -
Page 19
Mexican QSR Sales 72% 3% 3% 2% 2% 18% Taco Bell Del Taco Taco John's Taco Bueno Taco Time Independents Peter Waller President & Chief Concept Ofï¬cer Bob Nilsen Chief Operating Ofï¬cer 17 -
Page 20
... of our new franchise partners has allowed us to continue to build a solid franchise system. The Franchise Partners Advisory Council (FPAC) is a strong initiative for gaining alignment and serves as a resource for TRI senior management and franchisees to share business ideas and best practices. TRI... -
Page 21
Peter Hearl Executive Vice President Pete Bassi President International System Sales By Brand 63% KFC 35% Pizza Hut 2% Taco Bell 19 -
Page 22
... system for eight to ten years. 20 Dave Deno Chief Financial Ofï¬cer A cornerstone of this new unit opportunity is multi-branding, a strategy that allows us to penetrate trade areas where single branding doesn't work. So far, our KFC and Taco Bell 2-n-1's have averaged over $1.4 million in sales... -
Page 23
...also working with our franchise partners and the Pepsi-Cola company to forge an industry leading beverage arrangement for the Tricon system in the United States. In the future, we'll be doing all we can to drive sales and maximize proï¬ts with even further initiatives - all designed to improve upon... -
Page 24
... Channel (% of Sales) Sources of System Sales in International Restaurants SNACKS BREAKFAST 2% LUNCH 24% DINE OUT 63% GREATER CHINA 11% DINE IN 37% AMERICAS 21% EUROPE S. AFRICA 25% ASIA PACIFIC 43% DINNER 74% SNACKS BREAKFAST 2% DINNER 64% LUNCH 34% DINE OUT 71% DINE IN 29% Worldwide Units... -
Page 25
...to reï¬,ect the transfer of management responsibility. breakdown of worldwide system units Year-end 1999 unconsolidated afï¬liates company franchised licensed total U.S. KFC Pizza Hut Taco Bell Total U.S. International KFC Pizza Hut Taco Bell Total International Total 1,439 2,355 1,190 4,984... -
Page 26
... of KFC, Pizza Hut and Taco Bell (the "Core Business(es)") and is the world's largest quick service restaurant ("QSR") company based on the number of system units. Separately, each brand ranks in the top ten among QSR chains in U.S. system sales and units. Our 9,000 plus international units make... -
Page 27
...5 for a detailed discussion of our unusual items. Store Portfolio Perspectives. For the last several years, we have been strategically reducing our share of total system units by selling Company restaurants to existing and new franchisees where their expertise can be leveraged to improve our overall... -
Page 28
... % B(W) vs. 1997 System Sales $ 21,762 6 Revenues Company sales $ 7,099 (10) Franchise and 723 15 license fees(1) Total Revenues $ 7,822 (8) Company Restaurant Margin $ 1,091 3 % of sales 15.4% 1.9 ppts). Ongoing operating proï¬t $ 881 15 Accounting changes(2) 29 NM Facility actions net gain (loss... -
Page 29
... driven by units acquired from us and new unit development primarily in Asia and at Taco Bell in the U.S., partially offset by store closures by franchisees and licensees. Worldwide Company Restaurant Margin 1999 1998 1997 Company sales Food and paper Payroll and employee beneï¬ts Occupancy... -
Page 30
... to relocate our processing center from Wichita to other existing restaurant support centers of $14 million. In addition, we experienced increased administrative expenses as an independent, publicly owned company and incurred additional expenses Worldwide Facility Actions Net (Gain) Loss related to... -
Page 31
... in our evaluations, and improved performance in 1998, primarily at Pizza Hut in the U.S. Our 1999 refranchising gains, store closure costs and impairment charges are not necessarily indicative of future results. Worldwide Operating Proï¬t % B(W) 1999 vs. 1998 1998 % B(W) vs. 1997 Our net interest... -
Page 32
... or 4% in 1999. The improvement was driven by new unit development, led by Taco Bell franchisees and same store sales growth at our three U.S. concepts. These increases were partially offset by store closures, primarily at Pizza Hut and Taco Bell. In 1998, system sales increased $511 million or... -
Page 33
... check averages from these transactions and declines in other products. Same store sales at Taco Bell were ï¬,at as an increase in effective net pricing of approximately 4% was fully offset by transaction declines. In the fourth quarter, Taco Bell introduced a new hot, fried product, the Chalupa... -
Page 34
...largely due to the biennial conferences at Pizza Hut and Taco Bell to support our corporate culture initiatives. In 1998, ongoing operating proï¬t increased approximately $137 million or 23%. Excluding the effect of our Non-core Businesses, our ongoing operating proï¬t increased approximately $150... -
Page 35
... of sales are for cash while payment to suppliers for food and supply inventories carry longer payment terms, generally from 10-30 days. The decline in accounts payable was a result of the reduction in the number of our restaurants and timing in the payment of liabilities. Other current liabilities... -
Page 36
... repayments and buy back shares under our current stock repurchase program. Consolidated Financial Condition Assets decreased $570 million or 13% to $4.0 billion at yearend 1999. This decrease is primarily attributable to the portfolio effect and a decrease in cash and short-term investments. The... -
Page 37
... franchise community are working closely together to proactively address the bankruptcy situation and develop appropriate contingency plans. It is our intention to take all actions reasonably necessary and prudent to ensure continued supply of restaurant products and equipment to the TRICON system... -
Page 38
... by our independent actuary for both the current and prior years in which we retained some risk of loss. We believe the favorable adjustments are a direct result of our recent investments in safety and security programs to better manage risk at the store level. We will continue to make adjustments... -
Page 39
... supply of restaurant products and equipment in our stores; our ability to complete our conversion plans or the ability of our key suppliers to be Euro-compliant; our potential inability to identify qualiï¬ed franchisees to purchase restaurants at prices we consider appropriate under our strategy... -
Page 40
... 27, 1997 (in millions, except per share amounts) 1999 $ 7,099 723 7,822 1998 1997 Revenues Company sales Franchise and license fees $ 7,852 627 8,479 $ 9,112 578 9,690 Costs and Expenses, net Company restaurants Food and paper Payroll and employee beneï¬ts Occupancy and other operating... -
Page 41
... current liabilities Income taxes payable Net change in operating working capital Net Cash Provided by Operating Activities Cash Flows - Investing Activities Capital spending Refranchising of restaurants Acquisition of restaurants Sales of Non-core Businesses Sales of property, plant and equipment... -
Page 42
... Short-term borrowings Total Current Liabilities Long-term Debt Other Liabilities and Deferred Credits Deferred Income Taxes Total Liabilities Shareholders' Deï¬cit Preferred stock, no par value, 250 shares authorized; no shares issued Common stock, no par value, 750 shares authorized; 151 and 153... -
Page 43
...income TRICON Global Restaurants, Inc. and Subsidiaries Fiscal years ended December 25, 1999, December 26, 1998 and December 27, 1997 (in millions) Issued Common Stock Shares Amount Accumulated Investments by Other Accumulated and Advances Comprehensive Deï¬cit from PepsiCo Income Total Balance... -
Page 44
... restaurant company based on the number of system units, with almost 30,000 units in 104 countries and territories. References to TRICON throughout these Consolidated Financial Statements are made using the ï¬rst person notations of "we" or "us." Our worldwide businesses, KFC, Pizza Hut and Taco... -
Page 45
... single reportable operating segment. Internal Development Costs and Abandoned Site Costs. We capitalize direct internal payroll and payroll related costs and direct external costs associated with the acquisition of a site to be developed as a Company unit and the construction of a unit on that site... -
Page 46
... the sales of our restaurants to new and existing franchisees and the related initial franchise fees reduced by direct administrative costs of refranchising. We recognize gains on restaurant refranchisings when the sale transaction closes, the franchisee has a minimum amount of the purchase price in... -
Page 47
..."two-year history of operating losses" as our primary indicator of potential impairment. Based on the best information available, we write down an impaired restaurant to its estimated fair market value, which becomes its new cost basis. We generally measure estimated fair market value by discounting... -
Page 48
... costs to those site-speciï¬c costs incurred subsequent to the time that the real estate Foreign currency translation adjustment Minimum pension liability adjustment Total accumulated other comprehensive income $ (133) - $ (133) $ (148) (2) $ (150) note 4 Earnings Per Common Share ("EPS... -
Page 49
...could be effectively settled. In estimating this discount rate, we look at rates of return on high-quality corporate ï¬xed income securities currently available and expected to be available during the period to maturity of the pension beneï¬ts. As it is impractical to ï¬nd an investment portfolio... -
Page 50
... December 25, 1999, the amounts used apply only to the actions covered by the charge. The components of the 1997 fourth quarter charge are detailed below: U.S. International Worldwide end of the respective periods ceased when the stores were refranchised, closed or a subsequent decision was made to... -
Page 51
... actions net (gain) loss International Refranchising net gains(a) Store closure net costs Impairment charges for stores that will continue to be used in the business Impairment charges for stores to be closed in the future Facility actions net (gain) loss Worldwide Refranchising net gains(a) Store... -
Page 52
... fair market value of our idle Wichita processing facility was determined by using the estimated selling price based primarily on an evaluation by a qualiï¬ed third party. Unusual items in 1998 included: (1) an increase in the estimated costs of settlement of certain wage and hour litigation... -
Page 53
... Businesses held for disposal to estimated market value, less costs to sell; and (3) charges relating to the estimated costs of settlement of certain wage and hour litigation and the associated defense and other costs incurred. Intangible Assets, net 1999 1998 note 9 note 6 Reacquired franchise... -
Page 54
... by PepsiCo, to pay fees and expenses related to the Spin-off and the establishment of the Credit Facilities and for general corporate purposes. In 1997, we ï¬led with the Securities and Exchange Commission a shelf registration statement with respect to offerings of up to $2 billion of senior... -
Page 55
..., we had outstanding interest rate collars of $700 million, and our average pay rate was 5.4%. Under the contracts, we agreed with other parties to exchange, as required, the difference between the effective LIBOR rate and the cap or ï¬,oor rate if the effective LIBOR rates fall outside the collared... -
Page 56
... Debt-related derivative instruments Open contracts in an (asset) liability position - Debt, excluding capital leases $ 2,411 Guarantees $ - $ 2,377 $ 3,415 $ 3,431 Service cost Interest cost Expected return on plan assets Amortization of prior service cost Amortization of transition (asset... -
Page 57
... the years 2001- 2004; at that point our cost for a retiree will not increase. Assumed health care cost trend rates have a signiï¬cant effect on the amounts reported for our postretirement health care plans. The effects of a one percentage point increase or decrease in the assumed health care cost... -
Page 58
... Manager Stock Option Plan ("YUMBUCKS") and the TRICON Global Restaurants, Inc. SharePower Plan ("SharePower"). We may grant options to purchase up to 7.6 million and 22.5 million shares of stock under the 1999 LTIP and 1997 LTIP, respectively, at a price equal to or greater than the average market... -
Page 59
... employment during the two year vesting period. We expense the intrinsic value of the discount over the vesting period. We are phasing in certain program changes to the EID Plan during 1999 and 2000. These changes include limiting investment options, primarily to phantom shares of our Common Stock... -
Page 60
...full-time U.S. salaried and certain hourly employees. Participants may elect to contribute up to 15% of their eligible compensation on a pre-tax basis. We are not required to make contributions to the Plan. In 1998, a Stock Ownership Program ("YUMSOP") was added to the TRICON Common Stock investment... -
Page 61
..., as a result of stock option exercises. In addition, goodwill and other intangibles were reduced by $22 million in 1999 as a result of the settlement of a disputed claim with the Internal Revenue Service relating to the deductibility of the amortization of reacquired franchise rights and other... -
Page 62
... 1999 1998 1997 note 20 United States International Corporate $ Reportable Operating Segments $ 315 139 16 470 $ $ 305 150 5 460 $ 381 157 3 $ 541 We are engaged principally in developing, operating, franchising or licensing the worldwide KFC, Pizza Hut and Taco Bell concepts. We also... -
Page 63
... of the restaurant distribution business previously included by PepsiCo in its restaurant segment, and to include the investment in and our equity income of unconsolidated afï¬liates within the international segment. We made this change to align our reporting with the way we internally review and... -
Page 64
... 1,300 current and former California restaurant general managers of Pizza Hut and PacPizza. The lawsuit alleges violations of state wage and hour laws involving unpaid overtime wages and vacation pay and seeks an unspeciï¬ed amount in damages. On January 12, 2000, the Court certiï¬ed a class of... -
Page 65
... class members prior to certiï¬cation of the class. In this cure process, Taco Bell has currently paid out less than $1 million. On January 26, 1999, the Court certiï¬ed a class of all current and former shift managers and crew members who claim one or more of the alleged violations. The lawsuit... -
Page 66
...bankruptcy unsecured creditors. The interest rate is prime plus 4%. To help ensure that our supply chain continues to remain open, we have begun to purchase (and take title to) supplies directly from suppliers (the "temporary direct purchase program") for use in our restaurants as well as for resale... -
Page 67
... Quarter Third Quarter Fourth Quarter Total Revenues: Company sales Franchise and license fees Total revenues Total costs and expenses Operating proï¬t Net income Diluted earnings per common share Operating proï¬t (loss) attributable to: Facility actions net gain Unusual items Net income (loss... -
Page 68
... internal control system, and appropriate actions are taken to address signiï¬cant control deï¬ciencies and other opportunities for improving the system as they are identiï¬ed. The ï¬nancial statements have been audited and reported on by our independent auditors, KPMG LLP, who were given free... -
Page 69
... Investments by and advances from PepsiCo Other Data: Number of stores at year-end(1) Company Unconsolidated Afï¬liates Franchisees Licensees System U.S. Company same store sales growth(1) KFC Pizza Hut Taco Bell Blended Shares outstanding at year-end (in millions) Market price per share at year... -
Page 70
...Long-term Savings) Tricon Savings Center P.O. Box 1389 Boston, MA 02104-1389 (888) 875-4015 (888) 875-4015 (617) 847-1013 (outside U.S.) Low-Cost Investment Plan Investors may purchase their initial share of stock through NAIC's Low-Cost Investment Plan. For details contact: National Association of... -
Page 71
... Restaurants International Aylwin B. Lewis 45 Executive Vice President Operations and New Business Development, Tricon Michael A. Miles 38 Chief Operating Ofï¬cer Pizza Hut USA Robert T. Nilsen 40 Chief Operating Ofï¬cer Taco Bell USA Charles E. Rawley 49 President and Chief Operating Ofï¬cer KFC... -
Page 72
Best pizzas under one roof! We do chicken right! Grande Taste. Loco Value. Alone we're delicious, together we're YUM! hungry for more information? contact: www.triconglobal.com