Samsung 2012 Annual Report Download
Download and view the complete annual report
Please find the complete 2012 Samsung annual report below. You can navigate through the pages in the report by either clicking on the pages listed below, or by using the keyword search tool below to find specific information within the annual report.-
 1
1 -
 2
2 -
 3
3 -
 4
4 -
 5
5 -
 6
6 -
 7
7 -
 8
8 -
 9
9 -
 10
10 -
 11
11 -
 12
12 -
13
-
14
-
15
-
16
-
17
-
18
-
19
-
20
-
21
-
22
-
23
-
24
-
25
-
26
-
27
-
28
-
29
-
30
-
31
-
32
-
33
-
34
-
35
-
36
-
37
-
38
-
39
-
40
-
41
-
42
-
43
-
44
-
45
-
46
-
47
-
48
-
49
-
50
-
51
-
52
-
53
-
54
-
55
-
56
-
57
-
58
-
59
-
60
 |
 |
2012
SAMSUNG ELECTRONICS
ANNUAL REPORT
Table of contents
-
Page 1
2012 SAMSUNG ELECTRONICS ANNUAL REPORT -
Page 2
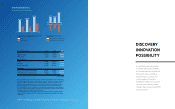
... Income Statements Sales Operating Profit Net Income Balance Sheets Assets Liabilities Shareholders' Equity Cash Flows Cash Flows from Operating Activities Cash Flows from Investing Activities Cash Flows from Financing Activities 2010 154,630 17,297 16,147 2011 165,002 15,644 13,759 2012 201... -
Page 3
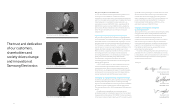
...: In 2012, the company achieved steady growth thanks to your continued trust and dedication. Despite intensifying competition, we recorded historic sales revenue and operating profit that strengthened our leadership in the global electronics industry. Based on consolidated financial statements, we... -
Page 4
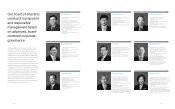
... of Technical Staff, AT&T Bell Laboratories (1984 ~1986) Jong-Kyun Shin • President & CEO, Samsung Electronics (2013 ~ Present) • President & Head, IT & Mobile Communications (2012 ~ Present) • Head, IT & Mobile Communications Division (2011~ 2012) • Head, Mobile Communications Business... -
Page 5
... business environment in 2012, Samsung Electronics recorded historic sales and profit. Our corporate and brand values also increased significantly. But we're hardly resting on laurels. We expect to strengthen competitiveness in our core businesses, bolstering our No. 1 status in mobile phones... -
Page 6
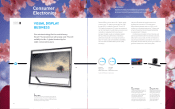
... Health & Medical Equipment Business Consumer Electronics We continuously develop and expand strategic products in our Consumer Electronics division. Since we first won top global market share in 2006, exceptional technology and innovative design have strengthened our unrivaled leadership in flat... -
Page 7
... our innovation in the AV business, last year we launched the world's first wireless audio dock with a built-in vacuum tube. In 2013, we employed a vacuum tube and wireless connection to TV to sound bar speakers AirTrack HW-F750, ensuring our lead in the global AV market with our new audio system... -
Page 8
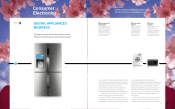
... pre-programmed recipes 01 02 03 Samsung Electronics works to satisfy differing consumer needs in diverse cultures around the world. We operate five Lifestyle Research Centers to support development of products that will bring more comfort and convenience to customers' lives. We also respond to... -
Page 9
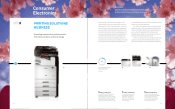
... corporate clients. In 2013, we will expand our hardware product lineups, solutions and services for the B2B market so we grow business for our partners and corporate clients together. 16% 01 2nd in Global A4 Laser Printer Market Share in 2012 Source: IDC 02 03 01 MultiXpress C9301 Series... -
Page 10
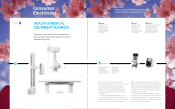
... Electronics has created world-class cutting-edge technologies across industries, including in IT, semiconductor, telecommunications and imaging. Building on those technologies, we are developing and launching differentiated diagnostic equipment to support a new and innovative medical environment... -
Page 11
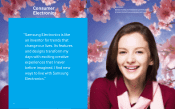
.... Samsung Electronics constantly reinvents tomorrow to pursue happier and richer lives. We explore the territory of the unknown to discover potential and fulfill greater promise. "Samsung Electronics is like an inventor for trends that change our lives. Its features and designs transform my days... -
Page 12
...Technological innovation at Samsung Electronics accounts for our growth and stellar performance. That's proven by annual sales of more than 400 million mobile devices worldwide, fueled by our amazing smartphone technology. Our telecommunications equipment and solutions power the global expansion of... -
Page 13
...reinforce our leadership in SMART camera market, including new NX and GALAXY Camera series. USD USD 8.7 Billion 7.5 Billion 30.4% 2011 2012 01 Top Global Smartphone Sales and Market Share in 2012 213 Million units sold Source: Strategy Analytics, IDC 16% Growth in Mobile PC Sales Revenue Best... -
Page 14
... office environment with Wireless LAN communications systems for enterprise customers Smart Scheduler TM 9.36% Indoor Small Cell Macrocell Outdoor Small Cell 01 Top Ratio of Contributions to Global LTE Patents in 2012 Contributions for 1,177 LTE patents Source: iRunway 2012 02 RRU CDU Samsung... -
Page 15
... series. 12.1% 11.3% 01 Global CSC (Mirrorless Camera) Market Share Global Compact Camera Market Share 02 03 Source: GfK (based on Q4 2012 sales revenue) 01 NX300 An interchangeable-lens SMART Compact System camera with 20.3-megapixel APS-C CMOS sensor, fast Hybrid Auto Focus (AF) system... -
Page 16
IT & Mobile Communications INNOVATION Samsung Electronics is creating a culture of infinite possibilities that enriches lives and amazes the world. The deep trust and commitment of our customers drives our continuous efforts to lead change and innovation. "Passion gives us essential energy for ... -
Page 17
... Solutions Memory Business System LSI Business LED Business Samsung Electronics is expanding its market leadership in the memory business by demonstrating superior technology and dramatic cost savings. That is generating exciting prospects. We are expanding our highly profitable differentiated... -
Page 18
...software, or "3S Innovation Technology." With increasingly convenient and eco-friendly nextgeneration memory products and solutions, Samsung Electronics will pioneer the green IT era by creating deeper customer value and conserving our environment. 41.4% 40.0% 01 Global DRAM Market Share Global... -
Page 19
.... In 2013, we plan to increase sales of our core products and expand our high-value product lineups to secure our position in the mobile industry. As a global system semiconductor company with product leadership and process technology prowess, we will continue to grow alongside our customers. 34 -
Page 20
..., Samsung Electronics has developed the world's best eco-friendly LED lighting solutions that include LED packages, LED display modules, LED light engines and LED retrofit lamps. We launched a new series of product portfolios that offer a range of energy savings, brightness levels and price points... -
Page 21
Device Solutions POSSIBILITY Our future is yet to be determined. We can't assume tomorrow's promise. We must shape it with our vision and effort. Samsung Electronics proposes the possibility of a positive future for us all. "You help me to dream and brighten my every possibility. You recognize who... -
Page 22
... new value through Eco-Innovation and green management throughout our entire product lifecycle, from production to consumption. In 2012, we reduced greenhouse gas emissions by up to 44% over 2008, based on sales, by adopting greenhouse gas reduction systems and energy savings at our global complexes... -
Page 23
... value that society shares. By experiencing the rich opportunities of today and the limitless possibilities of tomorrow, we all become part of the Samsung Electronics story. Report of Independent Auditors Consolidated Financial Statements Consolidated Statements of Financial Position Consolidated... -
Page 24
... income, changes in equity and cash flow for the years ended December 31, 2012 and 2011, and the related notes. These financial statements are the responsibility of the Company's management. Our responsibility is to express an opinion on these consolidated financial statements based on our audit... -
Page 25
...-sale financial assets Trade and other receivables Advances Prepaid expenses Inventories Other current assets Total current assets Non-current assets Available-for-sale financial assets Associates and joint ventures Property, plant and equipment Intangible assets Deposits Long-term prepaid expenses... -
Page 26
... 2012 2011 Profit for the year Items not to be reclassified subsequently to profit or loss : Remeasurement effect of employee benefit, net of tax Items to be reclassified subsequently to profit or loss : Changes in value of available-for-sale financial assets, net of tax Share of associates and... -
Page 27
... (decrease) in cash and cash equivalents Cash and cash equivalents Beginning of the year End of the year The accompanying notes are an integral part of these consolidated financial statements. Balance at January 1, 2012 Profit for the year Available-for-sale financial assets, net of tax Share of... -
Page 28
... Technology business venture capital investments Manufacture and sales of LCD Manufacture of electronic devices Manufacture of semiconductor components Manufacture of semiconductor/FPD Semiconductor equipments Repair service for electronic devices Sale of consumer electronics General logistics... -
Page 29
...Samsung Russia Service Center (SRSC) Samsung Opto-Electronics GmbH (SOG) Samsung Electronics Limited (SEL) Samsung Telecoms (UK) (STUK) Samsung Denmark Research Center (SDRC) Samsung France Research Center (SFRC) Samsung Cambridge Solution Centre (SCSC) Samsung Electronics West Africa (SEWA) Samsung... -
Page 30
... Electronics (SAVINA) Samsung Asia Private (SAPL) Samsung India Electronics (SIEL) Samsung India Software Operations (SISO) Samsung Electronics Australia (SEAU) Industry Sale of electronic devices R&D Sale and services of communication equipments Technology business investment Manufacture and sales... -
Page 31
... financial data of major consolidated subsidiaries is as follows: (1) 2012 (In millions of Korean won) (2) 2011 (In millions of Korean won) 2012 Assets Samsung Display (SDC) Samsung Electronics America (SEA) Samsung Austin Semiconductor (SAS) Samsung Semiconductor (SSI) Samsung (China) Investment... -
Page 32
...Area Medison Healthcare Prosonic Domestic Samsung Mobile Display SLCD Samsung Venture Capital Union #7 SEHF Korea Samsung LED America (SLA) America HX Diagnostics (HX) HX Reagents (HX Reagent) Nanoradio Europe Asia Samsung LED Europe GmbH (SLEG) Samsung Asia Private (SAPL) (*) Samsung Medison Japan... -
Page 33
... for the fiscal year beginning January 1, 2013. The Company is in the process of assessing the impact of the standard on the consolidated financial statements. subsidiaries by the Company. The cost of an acquisition is measured at the fair value of the assets given, equity instruments issued and... -
Page 34
... the present value of estimated future cash flows (excluding future credit losses that have not been incurred) discounted at the financial asset's original effective interest rate. The carrying amount of the asset is reduced and the amount of the loss is recognized in the consolidated statement of... -
Page 35
... cost using the effective interest method. employee will receive on retirement, usually dependent on one or more factors such as age, years of service and compensation. The liabilities recognized in the statement financial position in respect of defined benefit pension plans are the present values... -
Page 36
... corporate bonds, determines the appropriate discount rate at the end of each year. This is the interest rate that is used to determine the present value of estimated future cash 2012 Short-term financial instruments Other non-current assets - Long-term financial instruments ₩46,489 29 2011... -
Page 37
... ₩6,488,049 Total Assets Cash and cash equivalents Short-term financial instruments Short-term available-for-sale financial assets Trade and other receivables Long-term available-for-sale financial assets Deposits Others Total Assets at fair value through the profit and loss ₩130,057 ₩130... -
Page 38
... by credit insurance or collateral Group 2 - Customers experienced impairment of capital. As the trade payables Total ₩1,185,256 59,498 23,072 845,431 2,213,693 (2,569,682) 106,181 (94,466) 8. Transfers of Financial Assets Trade receivables have been discounted through factoring agreements... -
Page 39
...: For the years ended December 31, 2012 and 2011, changes in valuation gain (loss) recognized in equity (other comprehensive income) on short-term available-forsale financial assets are as follows: (In millions of Korean won) (In millions of Korean won) 2012 Number of Shares Owned Samsung Heavy... -
Page 40
... decline in realizable value below the acquisition cost amounted to ₩2,235 million and₩39 million for the year ended December 31, 2012 and 2011, respectively. For the years ended December 31, 2012 and 2011, changes in valuation gain (loss) on long-term available-for-sale financial assets are as... -
Page 41
... the Company's ownership of the voting rights in the entity. (C) Details of investments in associates and joint ventures as of December 31, 2012 and 2011 are as follows: (1) Associates (In millions of Korean won) The inventories recognized as expense and included in 'cost of sales' amounted... -
Page 42
... the year ended December 31, 2012 and 2011, are as follows: (1) Associates (In millions of Korean won) (F) Market value information of publicly listed associates as of December 31, 2012 is as follows: (In millions of Korean won) 2012 Investee Assets Samsung Card Samsung Electro-Mechanics Samsung... -
Page 43
... rate used to calculate the borrowing costs eligible for capitalization is 4.35%. (B) Details of property, plant and equipment's depreciation by line item as of December 31, 2012 and 2011, are as follows: (In millions of Korean won) 2012 Cost of sales Selling, general and administrative expenses... -
Page 44
... 31 2013 2014 2015 2016 Thereafter Total Long-term borrowings in local currency ₩ 493,860 2,583,907 380,722 573,564 84,835 ₩4,116,888 Account Cost of sales Selling general and administrative expenses Research and development expenses Total 2012 ₩327,869 353,909 105,192 ₩786,970 2011... -
Page 45
...general and administrative expenses Research and development expenses 2012 ₩291,355 185,125 260,267 ₩736,747 2011 ₩247,908 121,213 191,679 ₩560,800 The expected return on plan assets is based on the expected return multiplied with the respective percentage weight of the market-related value... -
Page 46
... currency exchange rates. (A) The Company accrues warranty reserves for estimated costs of future service, repairs and recalls, based on historical experience and terms of warranty programs. (B) The Company makes provisions for estimated royalty expenses related to technical assistance agreements... -
Page 47
...issue shares of common or preferred stock to investors other than current shareholders for issuance of depository receipts, general public subscription, urgent financing with financial institutions, and strategic alliance. SEC has issued global depositary receipts ("GDR") to overseas capital markets... -
Page 48
...). 2012 Dividend payout ratio 5.20% 2011 6.18% (D) Dividend Yield Ratio (Including interim dividends) 2012 Common Dividend yield ratio (*) 0.54% StockPreferred Stock 0.95% Common 0.52% 2011 StockPreferred Stock 0.85% (*) The average closing price in the stock market for a week before 2 trading... -
Page 49
... Amortization expenses Advertising expenses Sales promotion expenses Transportation expenses Warranty Public relation expenses Research and development expenses Others ₩ 580,300 ₩ 998,175 ₩1,276,208 2-10 years ₩ 606,700 ₩₩1,404,000 2-10 years 28. Financial Income and Costs Financial... -
Page 50
... tax rate applicable to profits of the Company as follows: (In millions of Korean won) Subtotal Deferred tax assets arising from carryforwards Undisposed accumulated deficit Tax credit carryforwards Deferred items recognized in other comprehensive income Valuation of available-for-sale financial... -
Page 51
...: Stock options. A calculation is done to determine the number of shares that could have been acquired at fair value (determined as the average annual market share price of the Company's shares) based on the monetary value of the subscription rights attached to outstanding share options. The number... -
Page 52
... debt expenses and etc. Gain on valuation of equity method Gain on disposal of property, plant and equipment Loss on disposal of property, plant and equipment Obsolescence and scrappage of inventories Gain on disposal of investments Gain on transfer of business Impairment losses on intangible assets... -
Page 53
... value of financial assets represents net of impairment loss to reflect the Company's maximum exposure to the credit risk. The top five customers account for approximately 12.9% and 12.9% and â,©3,074,791 million and â,©2,831,801 million of accounts receivables for the year ended 2012 and 2011... -
Page 54
...capital management is to maintain a sound capital structure. Consistent with others in the industry, the Company monitors capital on the basis of a total liabilities to equity ratio. This ratio is calculated as total liabilities divided by equity based on the consolidated financial statements. 2012... -
Page 55
... Consolidated (*) The total of non-current assets other than financial instruments, deferred tax assets, associates, and interests in joint ventures. 34. Related Parties (A) Associates The principal associate companies are Samsung SDI, Samsung Electro-mechanics, Samsung SDS, Samsung Techwin... -
Page 56
... Cash and cash equivalents Trade and other receivables Inventories Property, plant, and equipment Intangible assets Investments in Subsidiary, Associates and Joint Ventures Deferred income tax assets Other financial assets Trade and other payables Borrowings Defined benefit liability Other financial... -
Page 57
...the semiconductor/LCD equipment business. Prosonic Name of the new company Headquarters location Business Date of Spin-off Samsung Display Corporation Giheung-gu, Yongin-si, Gyeonggi-do LCD April 1, 2012 (2) Share exchange ratio and distribution (B) Merger of Samsung Display, Samsung Mobile Display... -
Page 58
..., Korea REGIONAL HEADQUARTERS North America Samsung Electronics North America Headquarters 85 Challenger Road, Ridgefield Park, NJ 07660, USA Samsung Electronics America Headquarters (Device Solutions) 3655 North First Street, San Jose, CA 95134, USA Latin America Samsung Electronics Latin America... -
Page 59
... Kenya Samsung Electronics East Africa (SEEA), Nairobi Tel: 254-20-3752-371 NORTH AMERICA Canada Samsung Electronics Canada Inc. (SECA), Toronto Tel: 1-905-542-3535 United States Samsung Electronics America Inc. (SEA), Ridgefield Park, N.J. Tel: 1-201-229-4000 Samsung Telecommunications America LLP... -
Page 60